

Spectrometers
Definition: devices for separating spectral components
More general term: optical metrology instruments
More specific terms: spectrographs, spectrophotometers
German: Spektrometer
Categories: general optics, light detection and characterization, optical metrology
How to cite the article; suggest additional literature
Author: Dr. Rüdiger Paschotta
Generally, an optical spectrometer is an instrument which can be used for investigating wavelength-dependent properties of light, substances or objects; the term is rather broad:
- An spectrometer may be an instrument which can spatially separate spectral components of light, so that they can be separately processed further.
- A spectrometer often also contains some photodetector(s) for analyzing the intensities. Such a spectrograph can be used for recording the optical spectrum of a light source. When equipped with intensity calibration, such devices are more specifically called spectroradiometers.
- Other optical spectrometers are made for analyzing substances or objects in terms of spectroscopic properties, for example wavelength-dependent transmittance or reflectance. They are more specifically called spectrophotometers, and find applications in fields like chemistry, for example.
Also many kinds of spectrometers outside the area off optics and photonics – for example, devices for measuring particle velocity or particle size distributions. This article, however, focuses entirely on spectrometers for spectrally analyzing light; see the article on spectrophotometers when the analysis of substances or objects is of interest.
Measurements with spectrometers typically deliver the optical power spectral density (PSD) as a function of the wavelength or optical frequency. Not all spectrometers deliver calibrated PSDs; often, the intensity readings are uncalibrated, possibly with a substantial wavelength dependence of the (unknown) calibration factor (responsivity).
There are also methods of spectral phase interferometry, which can measure not only the power spectral density but also the spectral phase.
There are spectrometers which also have imaging capabilities. See the articles on hyperspectral imaging and multispectral imaging.
If only the spectral linewidth of a laser beam needs to be measured, but not the detailed spectral shape, one can use other methods, e.g. perform a self-heterodyne linewidth measurement. With such methods, one can measure very small linewidths which are far below the typical resolution of a spectrometer.
Types of Spectrometers
Spectrometers Based on Diffraction Gratings or Prisms
Many spectrometers exploit the wavelength-dependent diffraction on one or several diffraction gratings, or the wavelength-dependent refraction at one or several prisms. Typically, an incident beam is collimated (made parallel) before being sent to a grating or prism. After that dispersive element, different wavelength components propagate in slightly different directions. The light may then go through some additional optics and finally get to a photodetector.
For obtaining a spectrograph (a non-scanning spectrometer), the photodetector may be a photodiode array, CCD array or similar, recording intensities over some spatial range, which correspond to a certain spectral interval. One does directly obtain a spectrum by mapping the detector pixels to wavelengths. The data acquisition is then relatively fast, because all wavelength components can be measured simultaneously. The resolution is then typically limited by the density of detector pixels, or possibly by the optical setup. Spectral peak positions may be determined with an accuracy better than according to the pixel spacing by using interpolation.
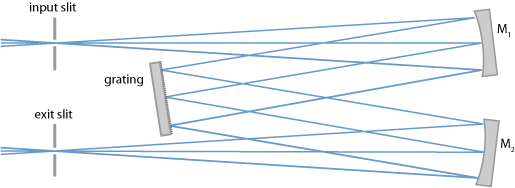
In a scanning spectrometer, the detector can be a single photodiode or a photomultiplier, placed after a narrow optical slit, so that only one narrow interval of wavelengths can get to the detector at one time. The slit position or the angular orientation of the grating or prism may then be moved such that a certain wavelength range can be scanned, assuming that the PSD of the input remains constant during that time. The setup then functions as a tunable monochromator. Figure 1 shows the common design of the Czerny–Turner monochromator. The acquisition time for a full spectrum can be long if a wide spectral range is scanned with high resolution and if the detector cannot be very fast, e.g. because the low optical power enforces a substantial average time. Long acquisition times may not only be inconvenient, but a real problem if the properties of the light source are not constant.
Some grating spectrometers are extremely compact, with a width of only a few centimeters. However, the highest performance – in particular in terms of resolution and sensitivity – is obtained with much larger instruments. Typical wavelength resolutions reached with such spectrometers are about 0.01 nm to 0.1 nm.
Depending on the type of spectrometer used (e.g. a grating spectrometer), various details have to be observed:
- The input light often has to be sent onto an entrance slit of variable width. For highest spectral resolution, the slit should be made narrow, but that reduces the transmitted power and may therefore lead to increased noise or longer acquisition times, particularly for sources with low brightness. Some spectrometers have a fiber input, either with multimode fiber or single-mode fiber. Multimode fibers make it easier to collect light, while single-mode fibers allow for highest spectrometer performance.
- Diffraction gratings are often used with the first diffraction order, but sometimes with higher diffraction orders in order to obtain a better performance. In any case, there can be problems with artifacts related to light being diffracted on other orders. If one finds spectral features which are hard to explain, one may check whether they could be such artifacts.
- The response of a spectrometer may depend on the polarization, because the diffraction efficiency of a grating or the reflection loss on a prism arrangement is polarization-dependent.
- Some spectrometers have to be calibrated by the user. For wavelength calibration, one may use certain discharge lamps, emitting line spectra with precisely defined wavelength components. Calibration of the responsivity for the whole wavelength interval is often more difficult. One possibility is to use an incandescent lamp with a known filament temperature or calibrated spectrum.
Interferometric Spectrometers
A high spectral resolution, but only in a very limited spectral range, is obtained with various types of interferometric spectrometers:
- Some instruments are based on a Fabry–Pérot interferometer, where the mirror spacing is mechanically scanned, e.g. via a piezo actuator, while the transmitted optical power is registered. The usable spectral interval is the so-called free spectral range, determined by the mirror distance; this is typically of the order of 0.1 GHz to 10 GHz, i.e., very small in terms of nanometers. The resolution bandwidth is the free spectral range divided by the finesse, the latter being determined essentially by the mirror reflectivities. A large distances between the mirrors allows for a higher performance, but also leads to a narrow free spectral range.
- Fourier-transform spectrometers can contain a Michelson interferometer, where one arm length can be mechanically scanned over a long distance (millimeters, centimeters or even more). The detector signal versus time, recorded during a full arm length scan, has to be Fourier-transformed to obtain the optical spectrum. A simplified version is the wavemeter, specialized on precisely measuring only the wavelength of a laser source, rather than recording full spectra.
- Arrayed waveguide gratings are sometimes used for very compact spectrometers. They are based on interference effects in a small waveguide device.
Dispersive Spectral Analysis
A totally different principle of operation can be realized for the spectral analysis of broadband ultrashort pulses. One may simply send such pulses through a long fiber, which introduces substantial chromatic dispersion. The latter then results in substantially different arrival times of different spectral components after the fiber: a pulse with an original pulse duration of far below 100 fs may then be spread over several nanoseconds, for example. By analyzing that light with a fast photodiode and oscilloscope, for example, one can obtain information on the spectrum. Of course, one should make sure that optical nonlinearities are not invalidating the results; in fibers, this strongly limits the allowable peak power.
A very attractive property of that method is the high speed with which a spectrum can be recorded. A single ultrashort pulse is sufficient for that purpose, whereas a conventional scanning spectrometer, for example, may require many seconds for that and would average the spectrum over many pulses of a pulse train.
Spectrometers for Extreme Spectral Regions
Traditional spectrometers work in the visible spectral range, with infrared or possibly with ultraviolet light. However, there are also spectrometers for operation in extreme spectral regions such as the extreme ultraviolet (EUV) or even the X-ray region, with wavelengths of only a few nanometers. Such devices may be based on diffraction gratings with very small line spacings, or in the X-ray region even on single crystals, exploiting the periodicity on the atomic scale. As photodetectors, one may use special X-ray CCD cameras or multichannel plate (MCP) detectors (→ photomultipliers).
Applications of Spectrometers
Because spectrometers find applications in a wide range of fields. Some examples:
- In optical technology and fundamental physics, spectrometers are applied for characterizing various kinds of light sources and optical components.
- Astronomy with optical telescopes often uses the spectrometers to acquire additional information on galaxies, stars and planets, for example.
- In chemistry, spectrometers can be used for identifying substances or measuring concentrations of multiple substances, for example in liquid solutions or in gases. See the article on spectrophotometers for more details. In the context of LIDAR, spectral analysis can be used for environmental monitoring.
See also the article on spectroscopy for more applications.
Suppliers
The RP Photonics Buyer's Guide contains 106 suppliers for spectrometers. Among them:
Questions and Comments from Users
Here you can submit questions and comments. As far as they get accepted by the author, they will appear above this paragraph together with the author’s answer. The author will decide on acceptance based on certain criteria. Essentially, the issue must be of sufficiently broad interest.
Please do not enter personal data here; we would otherwise delete it soon. (See also our privacy declaration.) If you wish to receive personal feedback or consultancy from the author, please contact him e.g. via e-mail.
By submitting the information, you give your consent to the potential publication of your inputs on our website according to our rules. (If you later retract your consent, we will delete those inputs.) As your inputs are first reviewed by the author, they may be published with some delay.
See also: spectrographs, spectrophotometers, optical spectrum, diffraction gratings, Fabry–Pérot interferometers, Fourier transform spectroscopy, wavemeters, chromatic dispersion, spectral phase interferometry, self-heterodyne linewidth measurement, hyperspectral imaging
and other articles in the categories general optics, light detection and characterization, optical metrology
 |
If you like this page, please share the link with your friends and colleagues, e.g. via social media:
These sharing buttons are implemented in a privacy-friendly way!