RP ProPulse – Numerical Simulation of Pulse Propagation
| Overview | Purpose | Model | Interface | Demos | Versions |
This software can be controlled with simple forms, where one just enters a couple of input parameters, start the calculation and obtains various outputs:
- Some numerical output data can be displayed in form fields and in the output area on the right side.
- Further, there can be multiple graphical diagrams for showing things like pulse properties in the time or frequency domain, or their dependencies on device or operation parameters.
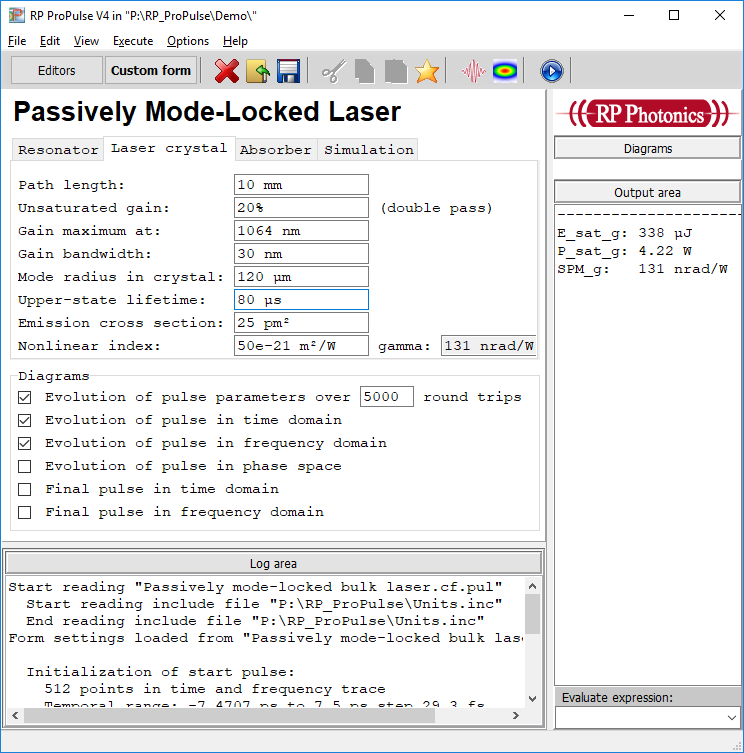
As an example, the screen shot below shows a form for designing mode-locked bulk lasers – including those working based on soliton mode locking. In various tabs, one can enter all the input parameters and select which diagrams should be made:
It is important to note that the forms and the underlying calculations are not hard-coded. You obtain script files, i.e., text files which define all the calculations and the generated graphical diagrams, and (optionally) a custom form. You can modify such scripts such they meet your specific needs. The user interface of the software provides powerful editors and a lot of additional helpful features for modifying such scripts or developing new scripts.
Scripting gives you enormous flexibility, which will hardly be matched by any other pulse simulation software on the market. With that, you can implement even most sophisticated models. Some examples:
- You can create a loop which continuously simulates additional round-trips of an ultrashort pulse in a laser resonator until the essential pulse properties (e.g. pulse energy, duration and bandwidth) do not change significantly any more. That way, you can automatically find the steady state of laser operation.
- It is possible to simulate the pulse propagation under the influence of quantum noise and statistically process the data to obtain noise spectra.
- You can create essential any kinds of graphical plots for analyzing the results – not just choose from a given set of diagrams.
- You can copy & paste within and between scripts, which is much simpler than going through many forms and entering inputs again.
The Script Language
RP ProPulse supports a powerful script language. Within a script, one can define
- the physical details of the modeled device (for example, a mode-locked laser), if required in fully parametrized form
- the properties of the initial pulse – for example, a soliton or Gaussian pulse with given parameters, or a full time or frequency trace including phase information
- some parameters for the numerical resolution
- code for the calculations to be done – for example, do some number of resonator round-trips and display certain parameters
- code for generating graphical output
As an example, see how the resonator of a simple actively mode-locked laser is defined:
resonator: linear
* Crystal: gain(l) = g(l) [P_sat_av = P_sat_g, KK = 0]
* Modulator: mod(t) = t_mod(t)
* OC: T_out = T_oc
resonator end
Each optical element (here e.g. the laser crystal) can have multiple “operators” acting on the pulse. The script language offers a large choice of such operators, e.g. for modeling laser crystals, SESAMs (semiconductor saturable absorber mirrors), bandpass filters and optical fibers.
When writing scripts, you do not have to start from scratch – usually, one will begin with a copy of one of the supplied demo files.
Of course, one can use the competent technical support to get solutions quickly.
Script Editors
For editing script code, the software offers powerful editors and related tools. A screen shot shows an editor:
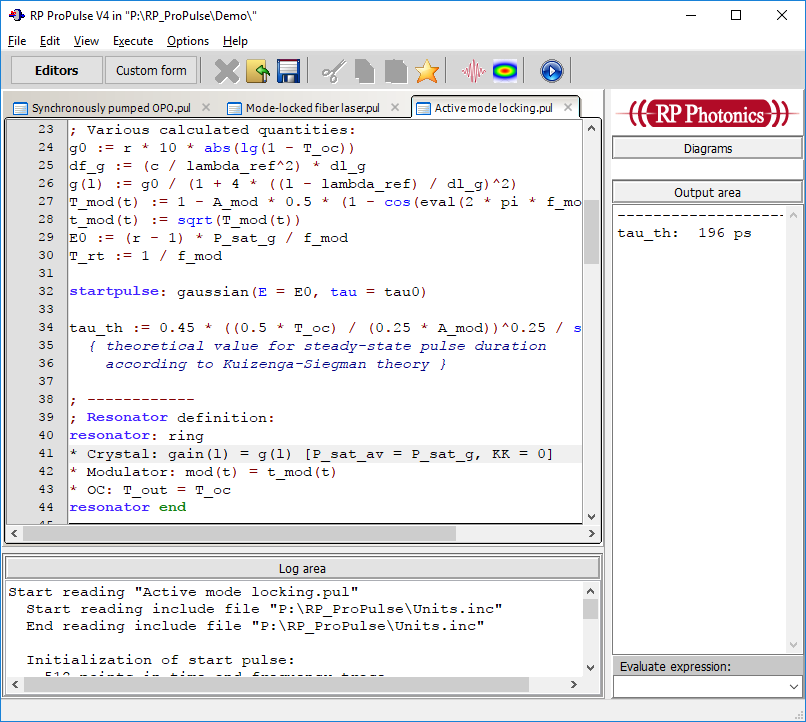
Some great features of such editors:
- Multilevel undo/redo functionality
- Syntax highlighting: recognized command or function names, keywords, comments etc. are shown with different colors. That makes it easier to understand the structure.
- Parameter hints: if you type in a function name followed by a parenthesis, the editor displays information on the required parameter list. That way it becomes much simpler to utilize the hundreds of supported functions.
- Syntax check: you can quickly have the syntax of a script checked without executing it.
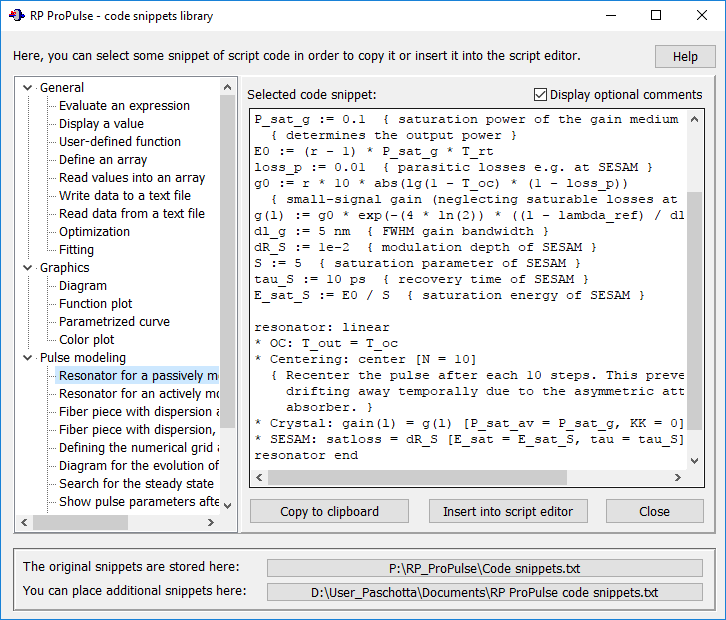
- Code snippets library: you can easily insert certain frequently used parts of code into your script. (See the screen shot below.) Users can create own code snippets as an extension for that library.
Graphical Output
Your script can define one or many different types of diagrams for visualizing the results of the calculations. Examples are shown below and on the pages for various example cases.
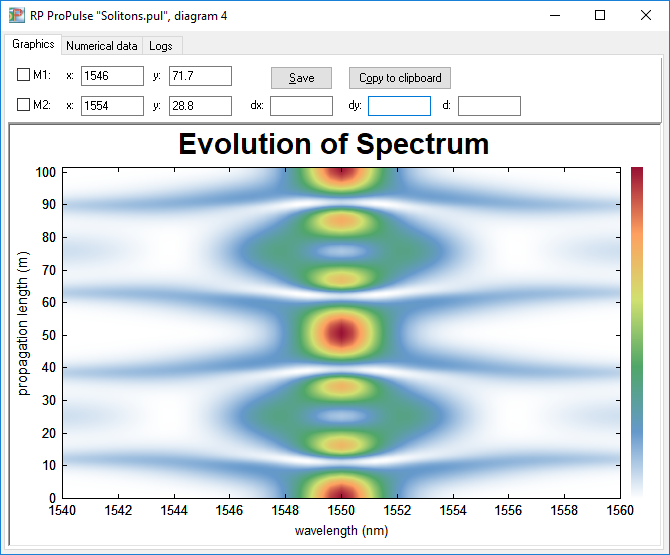
Those graphics windows have plenty of convenient features:
- measure positions and distances using one or two cursors
- save the graphics in GIF or PNG format
- export numerical data
- copy the graphics to the Windows clipboard
- recall the graphics from the last calculation run, so that you can clearly see any differences
- browse in multiple versions of a diagram (up to 1000)
Examples for the Graphical Output
The following diagrams have all been made with RP ProPulse and illustrate some of its features.
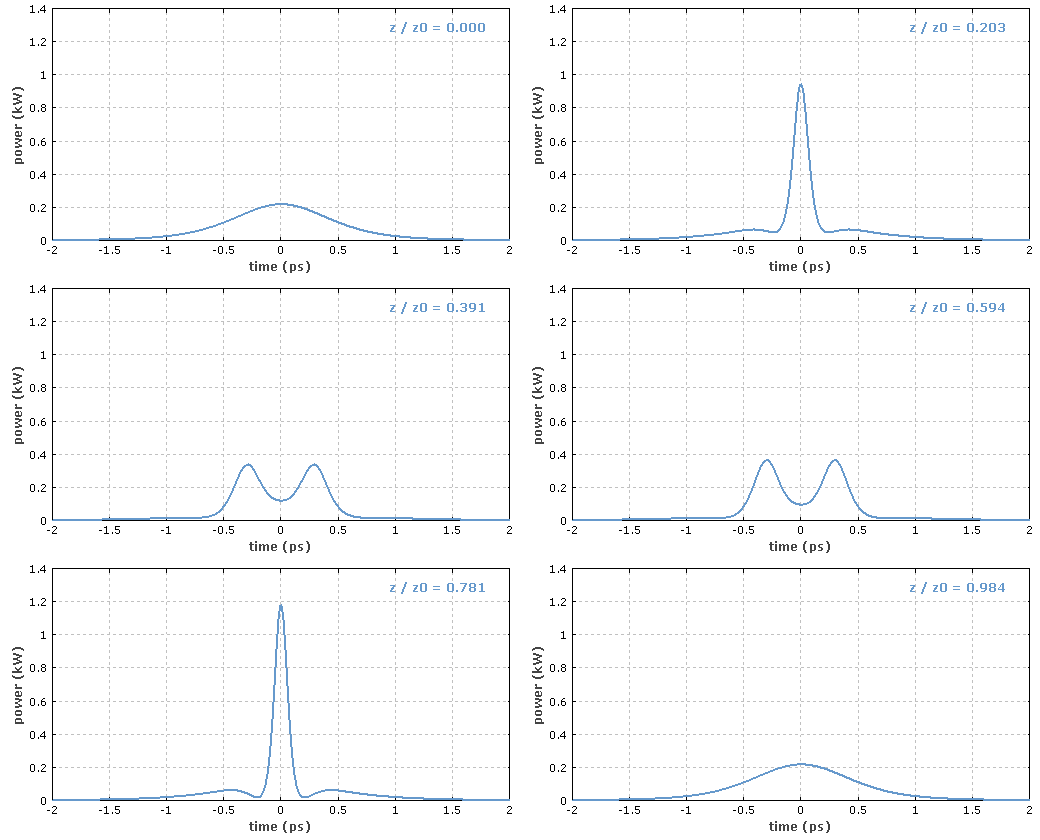
The first graph shows the temporal evolution of a third-order soliton. An animated GIF file has been prepared directly with RP ProPulse (without using additional software).
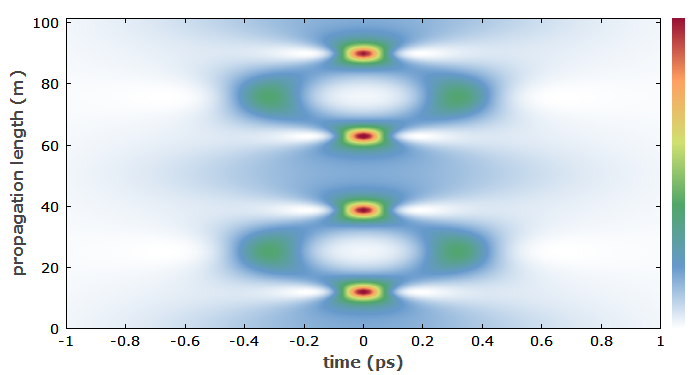
Another way to illustrate this evolution is a diagram where the color at each point, corresponding to a certain time (horizontal axis) and propagation distance (vertical axis), is calculated from the corresponding optical intensity. The soliton period is 50.4 m, i.e. the displayed range corresponds to about two soliton periods.
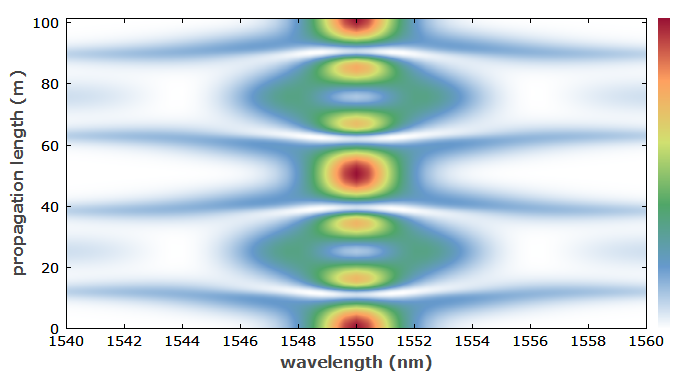
In a similar way, the following diagram shows the spectral evolution.
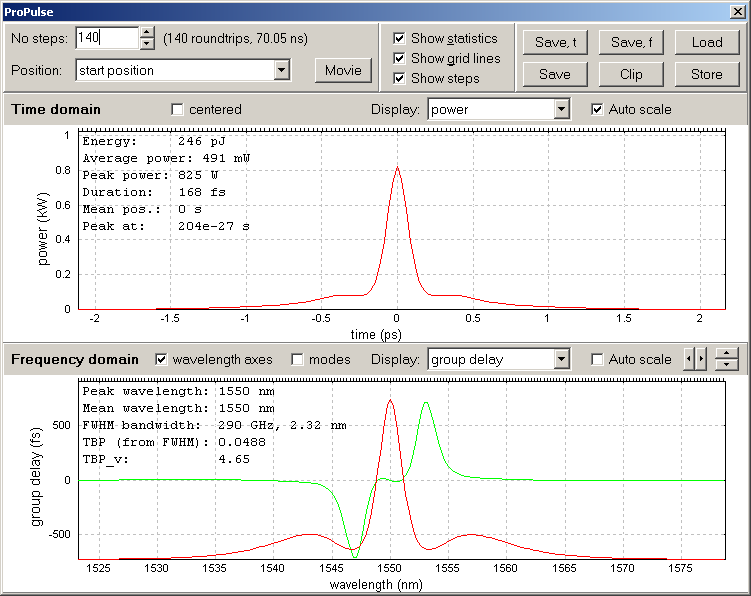
RP ProPulse also has an interactive display for pulse properties in the time and frequency domain. The following example shows the third-order soliton at one point in the fiber.
RP ProPulse can also display spectrograms of various kinds. In the example, intense chirped picosecond pulses at 1064 nm (282 THz) propagate in a fiber and generate a supercontinuum. At low frequencies, where the fiber dispersion is anomalous, several solitons can be recognized, which interact with high frequency components having the same group velocity. Low and high frequency components are delayed due to group velocity dispersion in the fiber. The temporal wings of the initial pulses are not yet converted for the given fiber length (see the narrowband structure at 282 THz).
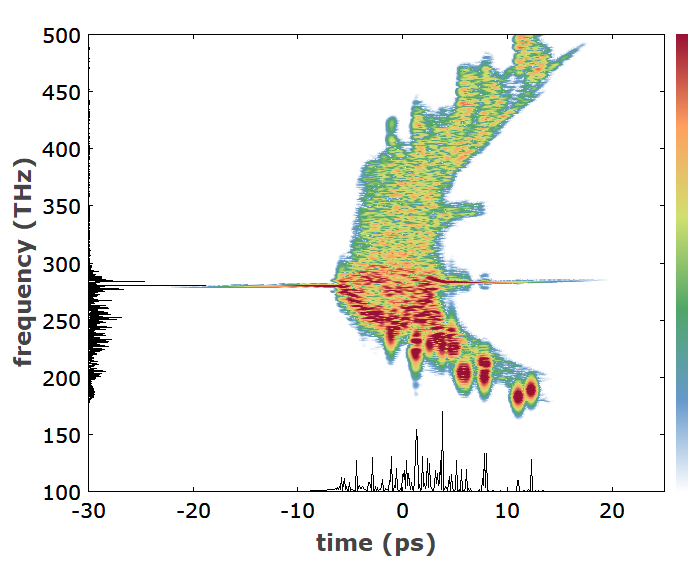
There is also an interactive form (not shown here) for generating spectrograms and Wigner plots. You can easily access the pulse at different locations in a resonator, for example, and after a variable number of round trips.
Comprehensive Documentation
RP ProPulse comes with very well worked out documentation in the form of a PDF manual. The manual explains in detail (on over 50 pages) the principles of the physical model, the user interface, the script language, etc. The quality of that documentation is essential both for efficient industrial design work and for scientific research: you need to know exactly what are the assumptions made, what is calculated, etc.
Technical Support
Any remaining problems can be addressed with the technical support. We make sure that any problems you may have will soon be solved.
If you have any further questions or need a quotation:
