Spectrograms
Definition: a type of diagrams which visualize optical or other signals
German: Spektrogramme
How to cite the article; suggest additional literature
Author: Dr. Rüdiger Paschotta
Spectrograms are common in acoustics, but are also sometimes used in optics, particularly in the context of ultrashort pulses (→ ultrafast optics). The underlying idea is essentially to display a kind of time-dependent spectrum: a Fourier transform is applied to different temporal sections of the signal. Mathematically, this leads to a signal of the form

where E(t) is the signal under investigation (e.g. the electric field of a pulse) and g(t) is a gate function, which may e.g. have a Gaussian shape. The temporally narrower the gain function, the higher is the temporal resolution, but also the lower is the spectral resolution. Therefore, the choice of gate function (and particularly its width) has a substantial influence on the resulting spectrograms.
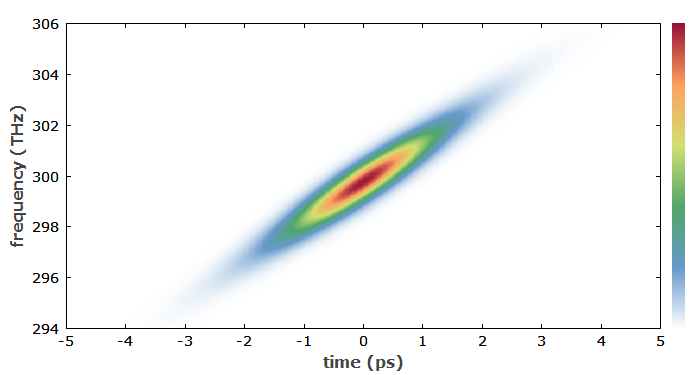
It is common to use a horizontal time axis and a vertical frequency (or wavelength) axis, and to encode the intensity for each combination of time and frequency with a gray scale or a color scale. The result is intuitive e.g. for an up-chirped ultrashort pulse (see Figure 1).
The spectrogram shown in Figure 1 is reminiscent of a graph showing the instantaneous frequency as a function of time. However, a vertical slice of the spectrogram always has some finite width, whereas the instantaneous frequency at any temporal position is a sharply defined value.

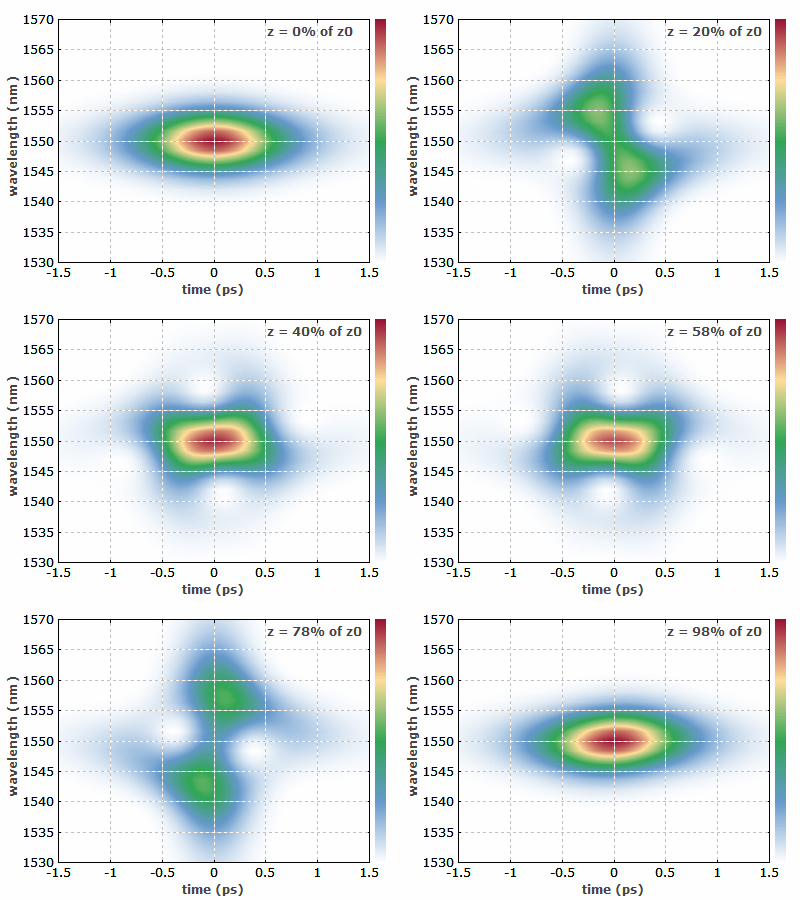
Figure 2, an animated spectrogram, shows how a third-order soliton pulse evolves in a fiber. The label (upper right side) indicates at which position in the fiber the pulse is currently displayed. One recognizes that both up- and down-chirps occur during the pulse evolution.

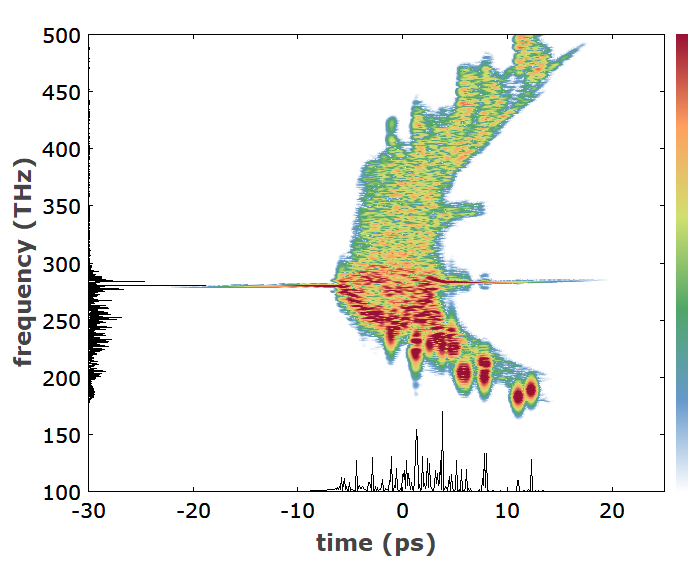
Figure 3 shows the spectrogram of an ultrashort pulse after passage through a photonic crystal fiber, in which supercontinuum generation occurred as a result of strong nonlinearities, with a strong influence of chromatic dispersion. In order to span a wider range of spectral intensities, a logarithmic color scale has been chosen. The pulse has split up into several pulses (soliton fission), as the temporal trace (black trace at the bottom) shows. The lower part of the diagram shows various bright spots representing soliton pulses, which carry a significant part of the overall energy.

It is also apparent that there is some unconverted light from the wings of the initial pulse (horizontal line in the middle) and a weak background extending to high optical frequencies. That background is to some extent correlated with the above-mentioned solitons, because it is generated in a phase-matched four-wave mixing process. Both the lowest and the highest frequency components exhibit a larger time delay than the medium frequency components; this is due to the chromatic dispersion of the fiber, which has its zero-dispersion wavelength near 1 μm.
Questions and Comments from Users
Here you can submit questions and comments. As far as they get accepted by the author, they will appear above this paragraph together with the author’s answer. The author will decide on acceptance based on certain criteria. Essentially, the issue must be of sufficiently broad interest.
Please do not enter personal data here; we would otherwise delete it soon. (See also our privacy declaration.) If you wish to receive personal feedback or consultancy from the author, please contact him e.g. via e-mail.
By submitting the information, you give your consent to the potential publication of your inputs on our website according to our rules. (If you later retract your consent, we will delete those inputs.) As your inputs are first reviewed by the author, they may be published with some delay.
See also: instantaneous frequency, optical spectrum, pulse characterization, supercontinuum generation
and other articles in the category light pulses
 |


If you like this page, please share the link with your friends and colleagues, e.g. via social media:
These sharing buttons are implemented in a privacy-friendly way!