Debugging Scripts in Software from RP Photonics
Most of our software products support a powerful script language, and the latest versions also contain a very convenient debugger:
- RP Fiber Power since V7
- RP Resonator since V4
- RP Coating since V4
- RP ProPulse since V4
The debugger can be very helpful when searching for errors in sophisticated simulation scripts. It can actually be used in two different ways:
- You can execute scripts command by command.
- You can also debug even within the evaluation of expressions. This is important since our software allows for expressions which may e.g. contain nested control structures.
In any case, you can inspect the system state after the execution of each command or sub-expression. In that way, you can conveniently find out in which step something went wrong. Or you just find out more quantitative details of your system than are normally displayed by the script.
In the following, the two debugging methods are explained in detail, demonstrating how well worked out that system is.
Executing Scripts Command by Command
The software can be in one of the following execution modes:
- Editing mode: you can edit scripts or the contents of forms. The software does not yet execute anything.
- Running mode: this is when a script is currently executed; you will normally just wait until the execution is finished and the results are displayed.
- Debug mode: in this mode, the software has interrupted the execution and waits for your decision on how to go on from there. It displays the current position in the executed script, and you can inspect the state of the system before deciding your next action – for example, to execute the next command, resume in running mode, or abort the execution.
Normally, when you execute a script or the contents of a form, the software will go from editing mode to running mode, and after execution it will return to editing mode. However, there are the following ways to get into debug mode:
- You may directly start debug mode by holding the Ctrl key when starting execution (e.g. Ctrl-F8 instead of F8).
- In running mode, you can press Ctrl-B (for “break”) or click on the “Break” button displayed on the main form below the button “End execution” (see below). There is also a break button with a violet cross which appears in the toolbar in running mode.
- The software also goes into debug mode when it hits a breakpoint (see below) in the executed script.
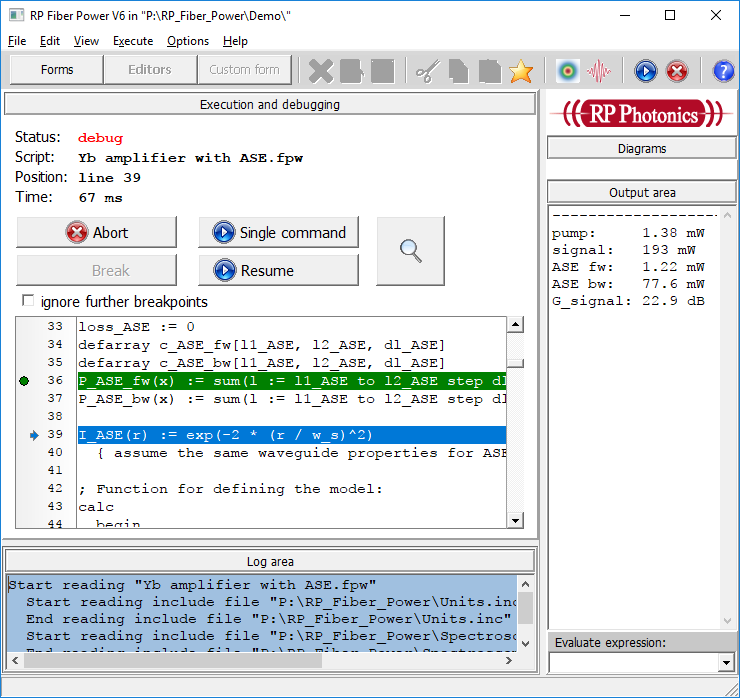
The screen shot below shows you how the main window looks in debug mode:

Below the toolbar, you find the “Execution and debugging” panel which displays some information:
- the status (execution mode) “debug”
- the currently executed file
- the current line number (and additional useful information on open loop structures, if applicable)
- the total execution time since the execution was started
There are also various buttons for determining the next action:
- Abort: the execution is definitely ended, and the software goes back into editing mode. - Break: this button can be used in running mode to interrupt the execution and get into debug mode. For example, you may do this if the execution seems to have got into an endless loop of commands, and you want to find out where that happened.
- Single command: execute only the next command, returning to debug mode thereafter.
- Resume: resume execution (in running mode) up to the end of the script or the next breakpoint (see below).
- Inspectors (magnifying glass): this calls the inspectors tool (see below), where you can e.g. check the current values of variables.
Below those buttons, in debug mode you find a display of the code, where the next line to be executed is shown in blue.
Breakpoints (where the software goes into debug mode, see above) can be set in two different ways:
- One can simply click on the left side of a code line in the editor.
- Also, a breakpoint can be contained in a script as a line beginning with “@”.
Both types of breakpoints can be made conditional, so that the execution will be stopped only when a certain condition is fulfilled.
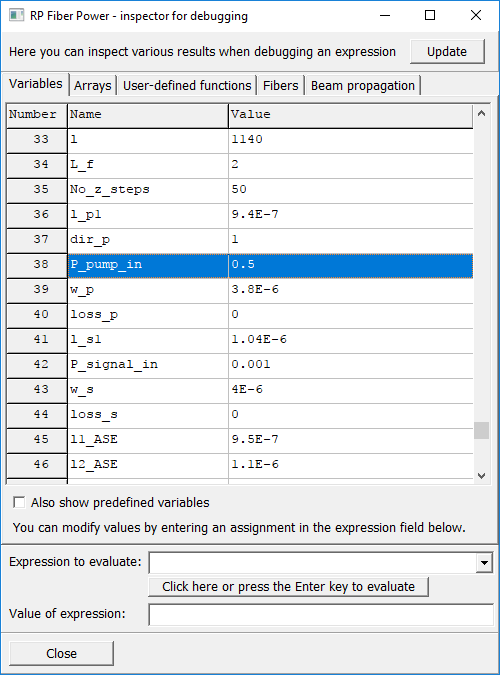
Here is a screen shot of the inspectors tool:

You see the tab for inspecting global variables; there are other tabs for inspecting arrays and user-defined functions. There can be additional physics-specific tabs, e.g. the defined fiber models and details of numerical beam propagation in RP Fiber Power.
In the bottom panel, you can enter any expression and get its value displayed below.
Debugging Expressions
The software has a powerful expression engine. With that you can do rather sophisticated things on the level of mathematical expressions. Therefore, it is often desirable to do debugging even within expressions.
You can set breakpoints within an expression – not with the “@” character, but by inserting a function call like debug('message'). When that function call is executed, the software will go into expression debug mode and display the passed message, helping you to understand what code you are currently looking at. You can later on leave debug mode by calling debug('') (or manually). The debug mode will also end once the end of the block containing the call of debug() has been reached. So you can inspect exactly those parts of the codes which are of interest.
The concept of using the debug() function instead of a simple breakpoint symbol (e.g. “@”) gives you additional flexibility. In particular, you may call the function only if a certain condition is fulfilled, so that effectively you have a conditional breakpoint. You may also use a calculated message string, better informing you about the current state (e.g. 'iteration 17').
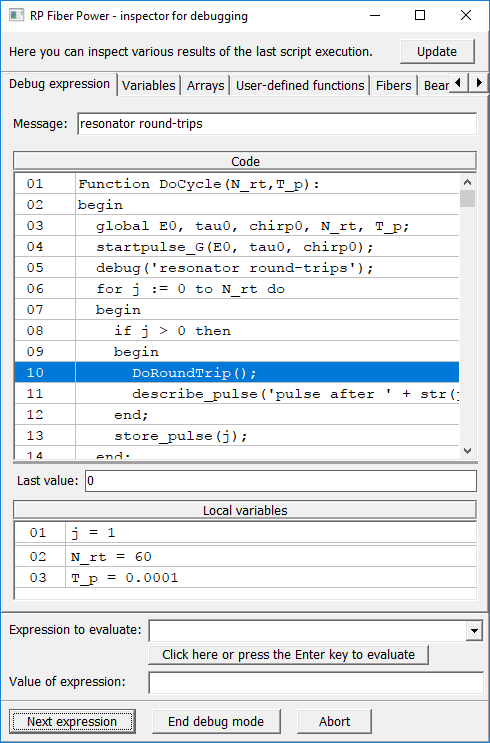
When the evaluation reaches such a breakpoint, the software will display the inspectors tool, but now displaying the tab “Debug expression”:

In the form, you can see the following:
- the message passed with the debug() function
- the code, where the next line to be evaluated is marked with blue background
- a field displaying the result of the last evaluated expression
- the local variables (here: a loop counter variable)
- the field for evaluating an expression
- the button “Next expression”: evaluate the next expression, stay in debug mode
- the button “End debug mode”: resume execution until the next debug point or the end of the block is reached
- the button “Abort”: abort the evaluation of the expression and subsequently the execution of the whole script
- the other tabs for inspecting global variables, arrays, etc.
There are various further useful features and tricks, explained in detail in the software documentation.
