RP Fiber Power – Simulation and Design Software
for Fiber Optics, Amplifiers and Fiber Lasers
| Overview | Features | Speed | Model |
| Data | Interface | Demos | Versions |
Example Case: Germanosilicate Multimode Fiber
Description of the Model
Here, we model a germanosilicate multimode fiber, where a supergaussian transverse profile of the germanium concentration is assumed. The refractive index is interpolated between that of silica and germania according to the local germania content:
r_co := 8 um  { core radius }
c_GeO2(r) :=
  { doping profile: fraction of GeO2 at radius r }
  if r <= r_co
  then 0.12 * exp(-(1.2 * r / r_co)^8)
  else 0  { index must be exactly constant for r > r_co }
n_f(r,lambda) := sqrt(c_GeO2(r) * n_GeO2(lambda)^2 + (1 - c_GeO2(r)) * n_SiO2(lambda)^2)
calc set_n_profile("n_f",r_co)
  { This assigns the index function to the fiber. }
The refractive indices of silica and germania are calculated from Sellmeier formulas. In that way, the wavelength dependence is included, which we need for calculating the chromatic dispersion.
From the wavelength-dependent refractive index profile, the mode solver can calculate all modes existing at any particular wavelength, including their intensity profiles, effective refractive index, group velocities, and group velocity dispersion.
Results
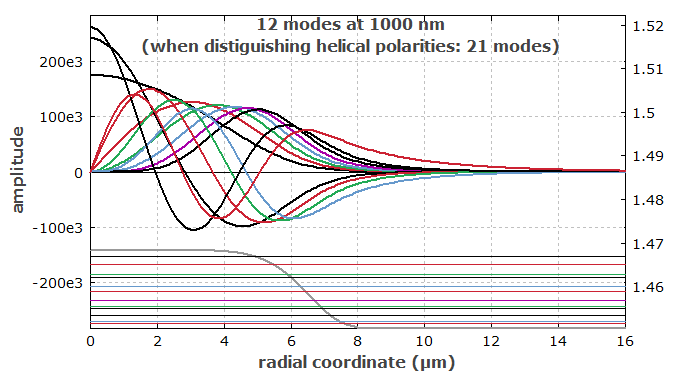
Figure 1 shows the radial functions of all modes existing at a wavelength of 1000 nm. In the lower part, it also shows the refractive index profile and the effective refractive indices of all modes. The colors are indicating the mode index l.

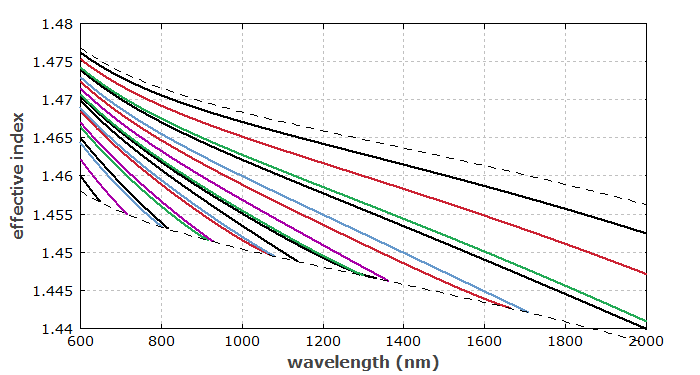
Figure 2 shows effective refractive indices of the modes as functions of the wavelength. These all lie between the refractive indices of the cladding and the on-axis index, as indicated with dashed gray lines.

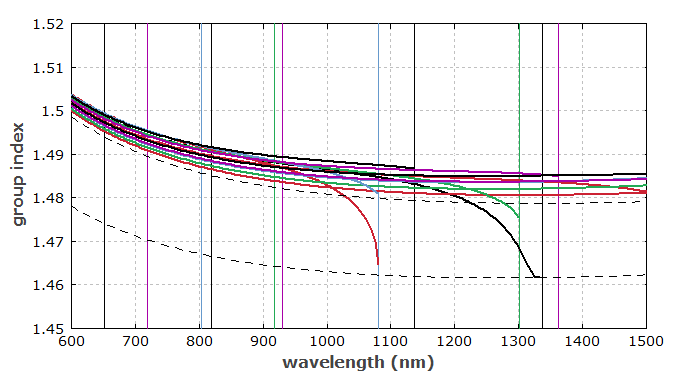
Figure 3 shows group indices of the modes as functions of the wavelength. Due to the influence of waveguide dispersion, these mostly lie above the group index on the fiber axis. Close to its cut-off, however, the group index of a mode drops substantially, because the mode becomes weakly guided, and the contribution of the waveguide dispersion becomes smaller. (The vertical lines indicate the cut-off wavelengths.)

