RP Fiber Power – Simulation and Design Software
for Fiber Optics, Amplifiers and Fiber Lasers
| Overview | Features | Speed | Model |
| Data | Interface | Demos | Versions |
Example Case: Pump Absorption in a Double-clad Fiber
Here we show how RP Fiber Power can be used to analyze and optimize double-clad fiber designs. As this involves some sophisticated details, the high flexibility of RP Fiber Power is essential for the task.
Description of the Model
We consider a double-clad fiber as used for high-power fiber lasers and amplifiers. It is well known that the absorption of pump light injected into the pump cladding can be reduced by the effect that some of the modes of the pump cladding have a weak overlap with the doped fiber core. We investigate this more closely.
Note that a mode-based approach is not very suitable for this analysis. One reason is that the pump cladding can have a very large number of modes. Another reason is that some reduction of symmetry is often used to improve the pump absorption. A mode solver which works well in that situation would be very difficult to develop and would require a lot of computation time.
Numerical beam propagation is therefore a more practical approach in this case. This, however, is also not trivial:
To be realistic, we need to construct a input pump wave which is quite incoherent, but still has sufficient spatial coherence for efficient launching. In this example case, we construct it as follows:
- We start with a field having a realistic intensity distribution (limited to the pump cladding) but entirely random optical phases. That would lead to a huge beam divergence, so that only a smaller part of the power could be launched into the pump cladding.
- We then Fourier-transform that field, filter out the high-frequency components (corresponding to large propagation angles), and transform back.
- We filter this once again in the spatial domain.
These operations require some script code:
defarray A0%[0, (N - 1) * dr, dr; 0, (N - 1) * dr, dr] (periodic)
defarray A0_f%[0, (N - 1) * dr, dr; 0, (N - 1) * dr, dr] (periodic)
w0 := 15 um { beam size parameter }
sg(x2) := exp(-x2^4)  { normalized super-Gaussian function }
calc
  begin
    { Calculate the initial beam profile: low spatial coherence,
      but high enough for efficient launching}
    var f_max, f_m;
    { First step: totally random amplitudes within the cladding }
    for x := -r_max to +r_max step dr do
      for y := -r_max to +r_max step dr do
         A0%[x, y] := if x^2 + y^2 < r_cl^2 and y < y_cut then
           rnd(-1) + i * rnd(-1);
    { Filter out higher spatial frequency components }
    FFT_n(A0%[], A0_f%[], +1);
    df := 1 / (2 * r_max);
    f_max := 0.5 * N * df;
    f_m := NA_cl / lambda; { maximum allowed spatial frequency }
    for fx := -f_max to +f_max step df do
      for fy := -f_max to +f_max step df do
        A0_f%[fx, fy] := sg((fx^2 + fy^2) / f_m^2) * A0_f%[fx, fy];
    FFT_n(A0_f%[], A0%[], -1);
    for x := -r_max to +r_max step dr do
      for y := -r_max to +r_max step dr do
        A0%[x, y] := sg((x^2 + y^2) / r_cl^2) * (y < y_cut) * A0%[x, y];
  end
A0%(x, y) := A0%[x, y]
The numerical grid is made somewhat larger than the pump cladding. We introduce an artificial absorption into the outer cladding, simulating the losses of that cladding, which would normally occur at the outer boundaries.
The numerical resolution needs to be relatively high due to the high numerical aperture (0.4) of the pump cladding. We use a transverse resolution of 0.47 μm and a longitudinal resolution of 3.3 μm.
Results
Initially, we assumed a circular pump cladding and a centered doped core. For the core absorption we assume 100 dB/m – a bit more than realistic, but that way we can use a shorter fiber length (500 mm), saving computation time.
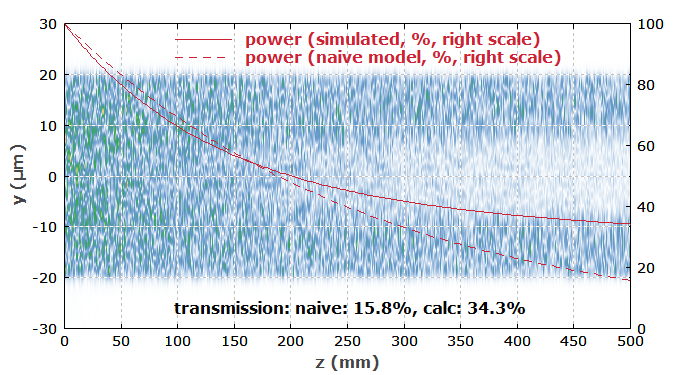
Figure 1 shows how the amplitude distribution evolves in the fiber. One sees that the intensity distribution develops a “hole” in the core region. That is the well known effect that after some length of fiber we have power dominantly in modes which exhibit very weak pump absorption. It would then not help much to use a longer fiber.

The solid red curve in Figure 1 shows how the pump power decays. This can be compared with the result of a “naive” analytical estimate (dashed curve), where a constant absorption coefficient according to the ratio of core and cladding areas is assumed. After some length of propagation, the two curves differ substantially due to the above-mentioned effect.
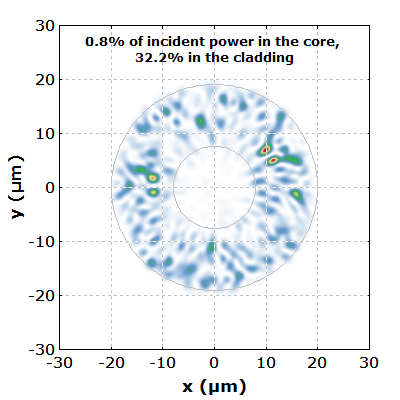
Figure 2 shows the intensity distribution at the fiber end. The core and cladding boundaries are indicated as gray circles.

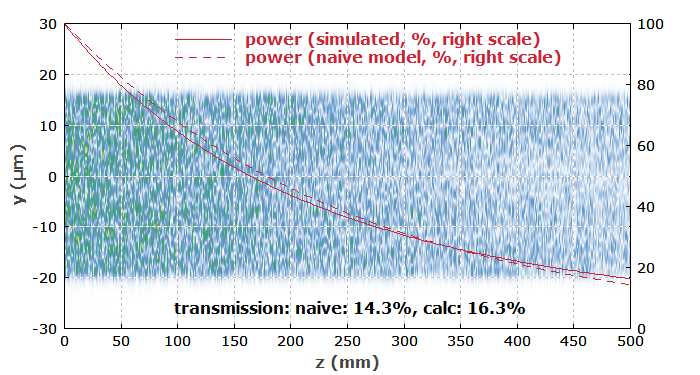
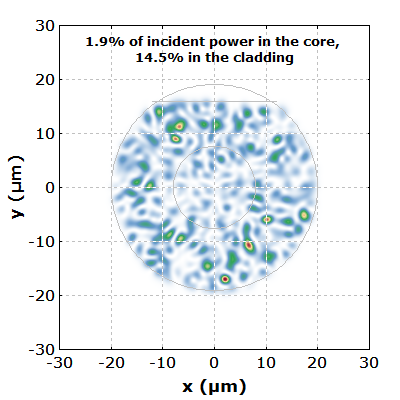
The pump absorption can be improved by using a D-shaped pump cladding: essentially, we cut off a section at the top of the pump cladding. This reduces the symmetry of the fiber such that we don't have these helical modes with low core overlap. Figures 3 and 4 show the results. The pump intensity distribution remains more uniform in the transverse direction, and the pump absorption is now even slightly better than according to the “naive” estimate.


Of course, one could now investigate modified cases, for example with an octagonal pump cladding, an off-center core, a bent fiber, etc. In that way one could optimize double-clad fibers with different designs.
