RP Fiber Power – Simulation and Design Software
for Fiber Optics, Amplifiers and Fiber Lasers
| Overview | Features | Speed | Model |
| Data | Interface | Demos | Versions |
Example Case: Regenerative Amplifier
Description of the Model
Here, we numerically simulate the amplification of ultrashort pulses in a regenerative amplifier. In such a device, a pulse circulates many times in a resonator containing an amplifier, until it is ejected when the pulse energy has reached a high value.
Such devices are very limited in performance when made with a fiber, because the nonlinear effects are very strong. Therefore, it is assumed that a bulk piece of doped glass is used, where the length is only 3 mm and the signal beam radius of 150 μm is relatively large. As such a bulk device is normally end-pumped, the model of RP Fiber Power is absolutely suitable, even though it is no fiber device.
Results
Figure 1 shows how the pulse parameters evolve in the regenerative amplifier. In the beginning, the pulse energy is low, and the nonlinearity remains negligible, but there is some temporal pulse broadening resulting from the chromatic dispersion. Once the pulse energy becomes high, self-phase modulation broadens the spectrum, and the pulse duration rises faster.
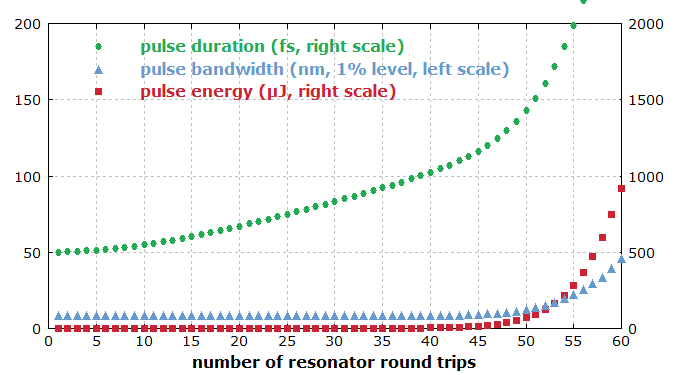
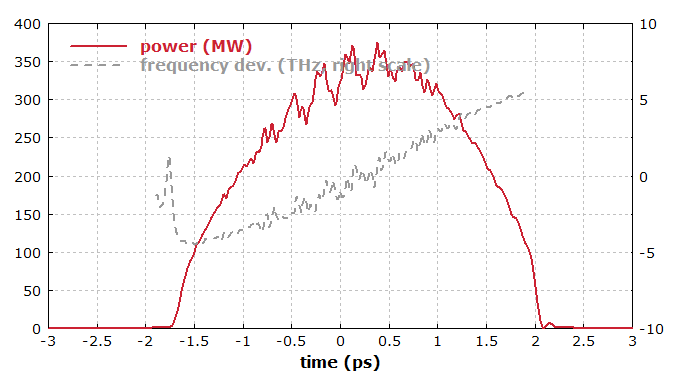
Figure 2 shows the final pulse (after 60 round trips) in the time domain. It is approximately a parabolic pulse, resulting from the interplay of (normal) chromatic dispersion and Kerr nonlinearity in the amplifying fiber. One also recognizes that the instantaneous frequency rises approximately linearly.
In the anomalous dispersion regime, the amplifier would not work well: the peak power would rise enormously, and consequently the nonlinearity would blow up the optical spectrum too much. This would result in strongly distorted pulses.
Figure 3 shows the spectrum of the final pulse. It exhibits some wiggles as a result of strong self-phase modulation, but the spectral phase is approximately parabolic, promising easy pulse compression after the amplifier (see below).
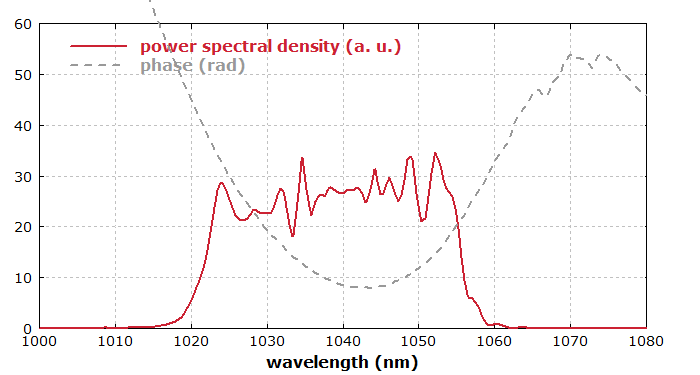
Figure 4 shows how the output pulses could be temporally compressed with a dispersive pulse compressor with second-order dispersion only. In text form, the results for optimized dispersion up to 4th order are also shown.
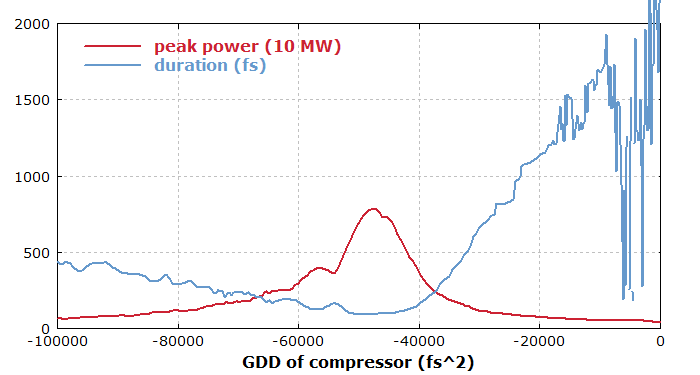
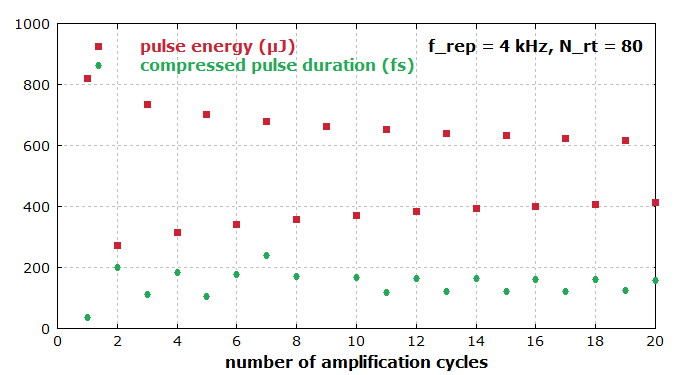
Figure 5 shows how the pulse parameters evolve in repetitive operation. The amplifier is continuously pumped, and pulse amplification is done with a repetition rate of 4 kHz. (The first pulse amplification is started after pumping for a longer time.) As the time between two amplification cycles is not sufficient to fully replenish the energy stored in the gain medium, the pulse parameters vary. For the chosen parameters, they do not approach a state steady, but oscillate in the long run between two substantially different values. One would normally not operate an amplifier in that regime.
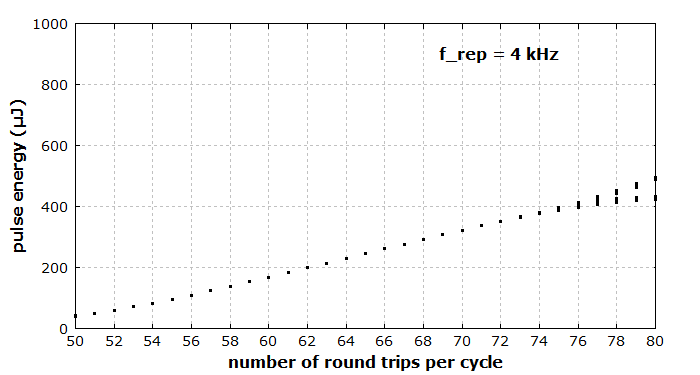
In Figure 6, we vary the number of resonator round-trips per amplification cycle. The repetition rate is kept fixed at 4 kHz. If the number of round-trips is low, e.g. 50, the pulse energy is low, because there is simply not enough gain to fully amplify the pulses. Above about 74 round-trips, we get into a regime where the pulse energy oscillates between two values – a so-called bifurcation. For some parameter sets, one may obtain further bifurcations and even a chaotic regime; that depends on parameters like the repetition rate, the number of round-trips for amplification, the initial pulse energy, the pump power, etc. In our case, however, a complete pulse break-up due to nonlinearities from 83 cycles on supersedes such effects.
