RP Fiber Power – Simulation and Design Software
for Fiber Optics, Amplifiers and Fiber Lasers
| Overview | Features | Speed | Model |
| Data | Interface | Demos | Versions |
Example Case: Pulse Generation in an Actively Q-switched Nd:YAG Laser
Description of the Model
Here, it is demonstrated that although RP Fiber Power was developed for fiber lasers, it can also be applied for simulating the performance of many bulk lasers. It is just required that the laser is end-pumped and the beam radii stay approximately constant throughout the crystal. In the considered situation, the Rayleigh length of the laser beam in the crystal is 215 mm, more than ten times the crystal length, so the assumption is very well fulfilled.
As the pump beam is assumed to be slightly misaligned, the radial symmetry is broken. Therefore, we use a rectangular grid rather than the usual ring structure. The resolution is chosen such that it is sufficient for properly sampling the Gaussian beams.
A dynamic simulation is done in two steps:
- First, the pump phase is simulated, where the Q-switch prevents lasing. This can be done with a large temporal step size, so that only a fraction of a second is required.
- Second, the pulse formation with open Q-switch is simulated. Here, we need a very small temporal step size (which is automatically chosen), and the calculation requires a few seconds on an ordinary PC.
Note that a finite switching time of the Q-switch is implemented. For infinitely fast switching, the temporal profile of the pulse would exhibit a significant modulation on the time scale of the round-trip time of the resonator. (This implies multiple longitudinal modes, of course.)
Note that in this model we assume that the beam radius of the laser beam stays constant during the pulse build-up – despite the effect of gain guiding. This is assumption is often, but not always fulfilled. We have a more refined demo case with wave propagation, where this assumption is not needed, and gain guiding effects can indeed be seen under certain circumstances.
Results
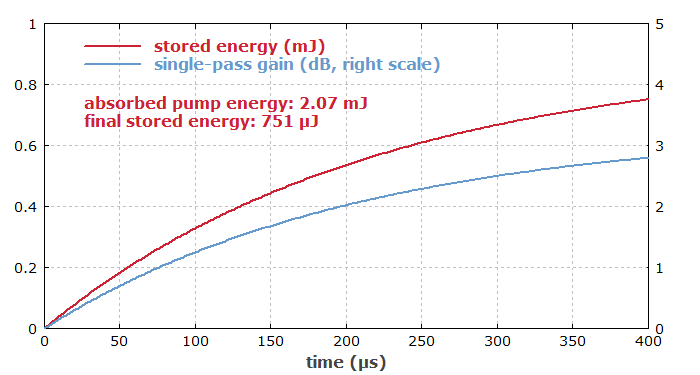
Figure 1 shows how the stored energy and signal gain are built up in the pump phase. The slope reduces more and more, because an increasing amount of fluorescence radiates away some of the energy.

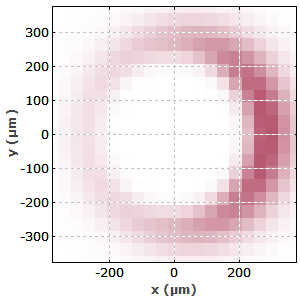
Figure 2 shows the transverse profile of the stored energy after energy extraction by the generated pulse. As the signal beam is slightly smaller than the pump beam, and the pump beam is misaligned, some excitation remains mainly on the right side.

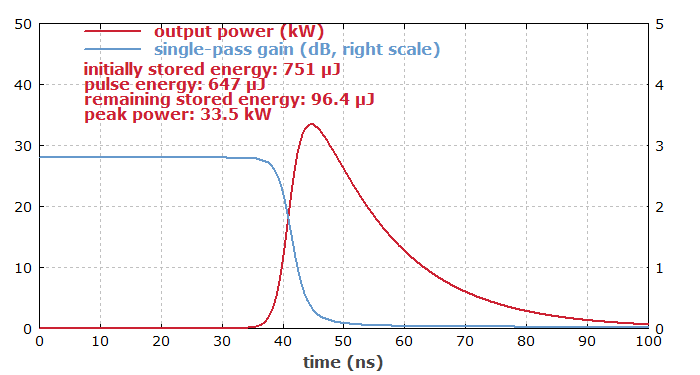
Figure 3 shows the evolution of output power and gain during the pulse formation. The pulse energy and peak power, among other data, are displayed in the diagram.

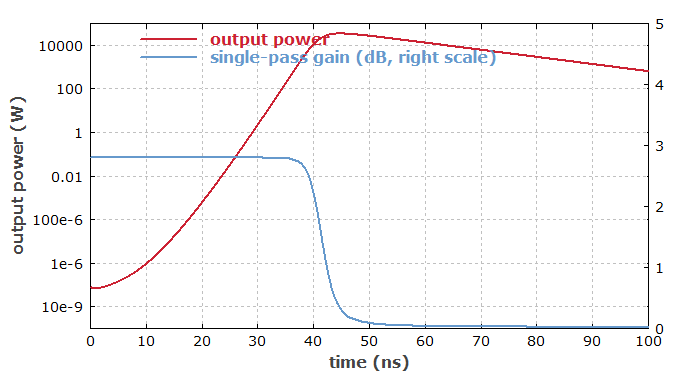
The last figure shows the evolution of output power and gain on a logarithmic scale. One sees how the laser power grows exponentially over several orders of magnitude, starting with a very low level from spontaneous emission.

It would be no problem to extend the model in various ways. For example, one could study the evolution of multiple transverse modes.
