RP Fiber Power – Simulation and Design Software
for Fiber Optics, Amplifiers and Fiber Lasers
| Overview | Features | Speed | Model |
| Data | Interface | Demos | Versions |
Example Case: Pulse Generation in a Q-switched Fiber Laser
Description of the Model
We numerically simulate pulse generation in a fiber laser with the following properties:
- The double-clad fiber has a uniform ytterbium doping concentration in its step-index single-mode core.
- The laser is continuously pumped from both ends.
- The output coupler on the right side is a fiber Bragg grating with 10% reflectivity in a 1-nm bandwidth around 1060 nm.
- A Q-switch is inserted on the left side of the active fiber. It has a finite switching time and a high suppression in the closed state.
- Time delays of 3 ns and 1 ns, respectively, are assumed for the propagation in undoped fibers on the left and right side of the active fiber.
- Amplified spontaneous emission is taken into account, as it limits the achievable gain and the stored energy.
The laser is first pumped until the steady state is reached. Then the Q-switch is opened for 500 ns, so that a pulse is emitted, and the Q-switched is closed again. These cycles are repeated with a repetition rate of 10 kHz.
Results
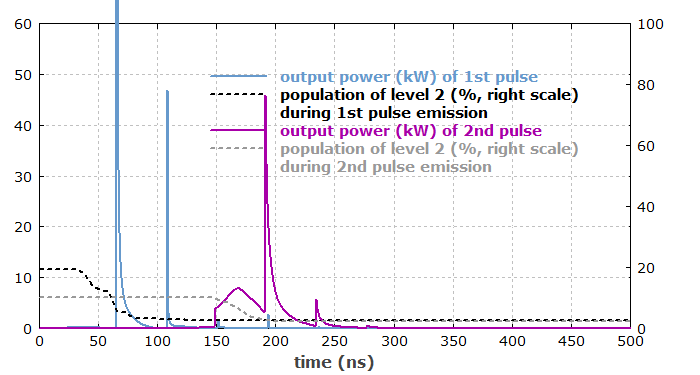
Figure 1 shows the time-dependent output powers in the first and second Q-switching cycle, and also the time dependence of the ytterbium excitation. In order to show both pulses on the same time scale, the indicated time is taken to be the time after opening the Q-switch.

The complicated pulse shapes, which are unusual for anyone being more familiar with Q-switched bulk lasers, are essentially a consequence of the high laser gain. Within a single resonator round trip, the optical energy within the laser resonator can rise from a value far below the saturation energy to a level well above the saturation energy. This leads to spikes with a duration well below the round-trip time.
As the repumping time between two pulses (≈ 10 μs) is too short to fully replenish the extracted energy, the second Q-switching cycle begins with a lower energy and thus a lower laser gain. Nevertheless, the first pulse has an even slightly lower energy, because it comes earlier (due to the higher gain) and therefore loses energy due to the finite switching speed of the Q-switch.
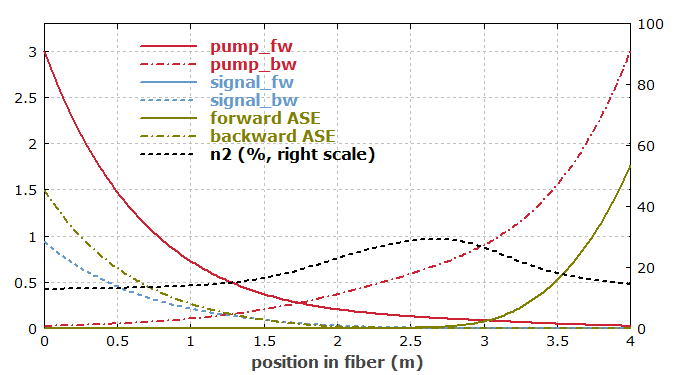
Figure 2 shows the optical powers and the degree of ytterbium excitation as functions of the position in the active fiber just before the first pulse is triggered. Despite the higher pump intensities near the ends, the excitation is lower there because of strong ASE. The situation is asymmetric because the fiber Bragg grating on the right side leads to strong ASE in backward direction within its reflection bandwidth, whereas forward ASE is not enhanced.

We see that a substantial power is extracted by amplified spontaneous emission; this limits the achievable gain and stored energy. For the situation after the pulse emission (not shown here), the gain is much lower, and ASE is negligible until sufficient energy is replenished by the pump source.
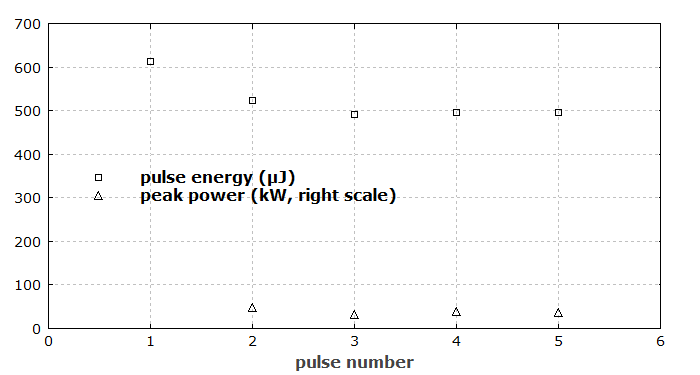
Figure 3 shows the evolution of pulse energy and peak power. After the emission of only 3 pulses, the steady state is nearly reached.

The first pulse starts with the fiber being pumped for a long time, so that it is in the steady state. As explained above, the energy of the first pulse is strongly reduced by losses at the Q-switch, having a finite switching time.
It becomes apparent that the analysis of the simulated behavior leads to a strongly improved physical understanding, which is particularly useful for the optimization of fiber lasers.
