RP Fiber Power – Simulation and Design Software
for Fiber Optics, Amplifiers and Fiber Lasers
| Overview | Features | Speed | Model |
| Data | Interface | Demos | Versions |
Example Case: Pulse Generation in a Passively Q-switched Nd:YAG Laser
Description of the Model
This model is similar to the one for an actively Q-switched Nd:YAG laser, but instead of an active Q switch, a Cr:YAG crystal is used as a saturable absorber for passive Q switching.
As a dynamic model can contain only a single “fiber”, the system has been treated like a single fiber containing both Nd3+ and Cr4+ ions, spread over the whole resonator length. This means that we don't use the usual simple energy level scheme, but a user-defined scheme with two non-interacting types of ions, each having two relevant electronic levels. (Short-lived higher levels can be ignored, as their populations are negligible.)
Results
Diagram 1 simulates only the pump phase. The simulation is stopped at the point where the round-trip net gain becomes positive.
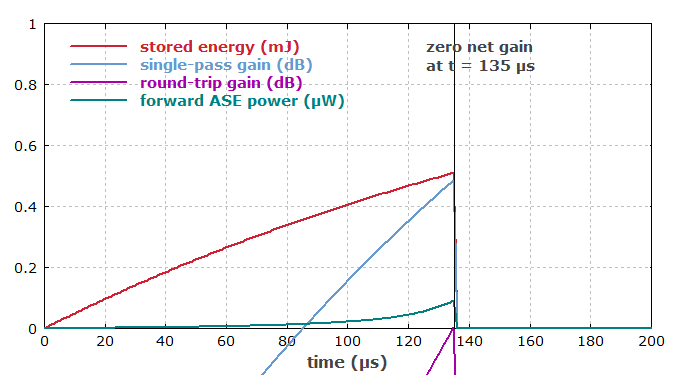
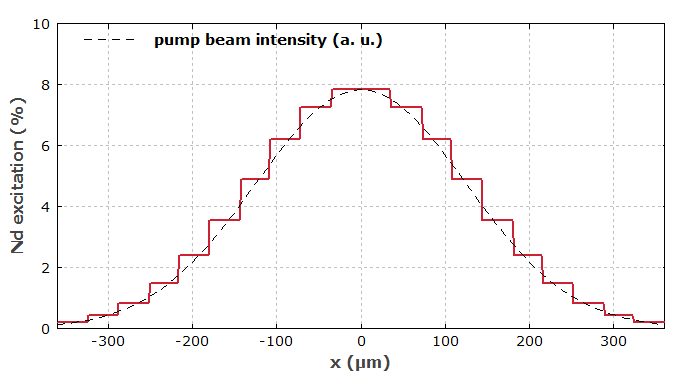
Diagram 2 shows the transverse profile of the Nd3+ excitation after pumping but before pulse emission. The shape of that curve corresponds to the pump profile.
Zero net gain is reached after 135 μs of pumping. Diagram 3 then simulates the pulse generation. Here, a full dynamic simulation taking into account propagation times is needed. This is in principle slower, but it has to span only a much smaller range of time. Therefore, we also get that done within a few seconds. The evolution of output power is shown on a logarithmic scale.
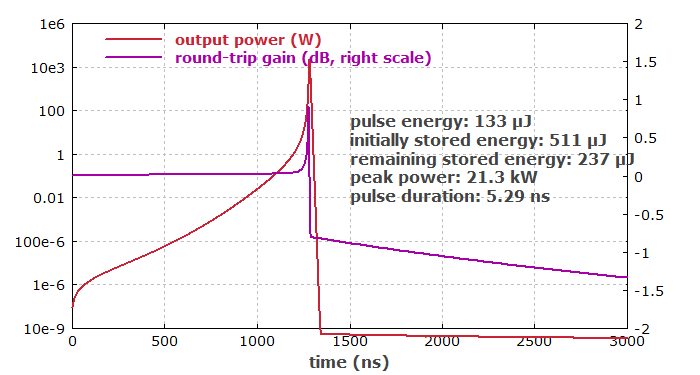
One can see that the output power grows with increased speed just in the beginning of the pulse emission, as the Cr:YAG absorber is then saturated. It is also apparent that the net gain drops after the pulse emission, as the saturable absorber recovers.
Diagram 4 shows the same with a linear scale for the power and a smaller temporal range.
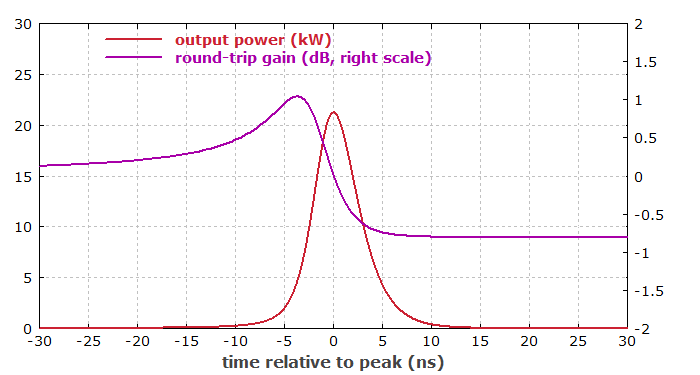
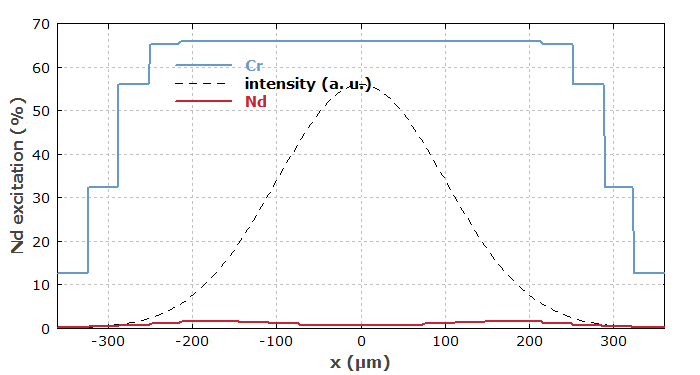
Diagram 5 shows the transverse profiles of the Nd3+ and Cr4+ excitations at the end. The Nd3+ excitation is largely depleted, and more strongly in the center of the beam profile. (Note that the laser beam has been assumed to be somewhat smaller than the pump beam.)
The whole simulation and generation of all the above diagrams takes only about 10 seconds on an ordinary PC.
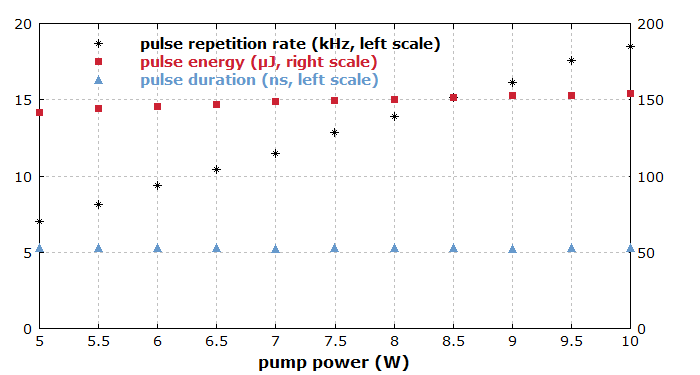
Finally, we can investigate the influence of the pump power. In diagram 6, for each pump power value we simulate two pumping/pulse cycles (more or less reaching the steady state) and display the resulting pulse parameters. It turns out that an increased pump power essentially only decreases the time required for pumping, but does not substantially change the pulse energy and duration.
