RP Fiber Power – Simulation and Design Software
for Fiber Optics, Amplifiers and Fiber Lasers
| Overview | Features | Speed | Model |
| Data | Interface | Demos | Versions |
Example Case: Parabolic Pulses in a Fiber Amplifier
Description of the Model
Here, we numerically simulate the amplification of originally unchirped ultrashort pulses in an Yb-doped fiber amplifier with normal chromatic dispersion.
The following code is used to define the input pulses, the fiber properties and a few numerical parameters:
lambda0 := 1030 nm
E0 := 0.1 nJ  { initial pulse energy }
tau0 := 100 fs  { initial pulse duration }

GVD_f := 20000 fs^2 { per meter }
n2_f := 3e-20  { nonlinear index }

N_t := 2^10  { number of grid points }
T := 60 * tau0  { width of temporal range }

DoPulsePropagation() :=
  begin
    set_pulse_grid(T, N_t, lambda0);
    startpulse_G(E0, tau0, 0);
    set_n2(n2_f);  { nonlinear index }
    set_GVD(GVD_f);  { group velocity dispersion (no higher-order dispersion) }
    pp_fiber(1, signal);
  end
The center wavelength and mode area are taken from the definition of the optical signal channel (not shown here).
As needed, one may add higher-order dispersion (possibly calculated with the mode solver), stimulated Raman scattering, more complicated input pulses, etc.
Results
Figure 1 shows the resulting amplified pulse. Due to the effects of the Kerr nonlinearity and the chromatic dispersion, the pulse has become much longer and is strongly chirped. The pulse shape is approximately parabolic. The results depend only weakly on the input pulse; for example, they are quite similar if its duration is doubled.
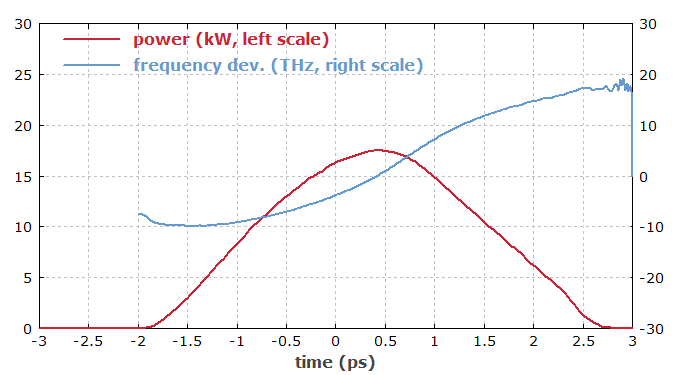
Figure 2 shows the spectral shape of the amplified pulse. The roughly parabolic shape of the spectral phase suggests already that dispersive compression with pure second-order dispersion should be suitable for strongly compressing the pulse (see below).
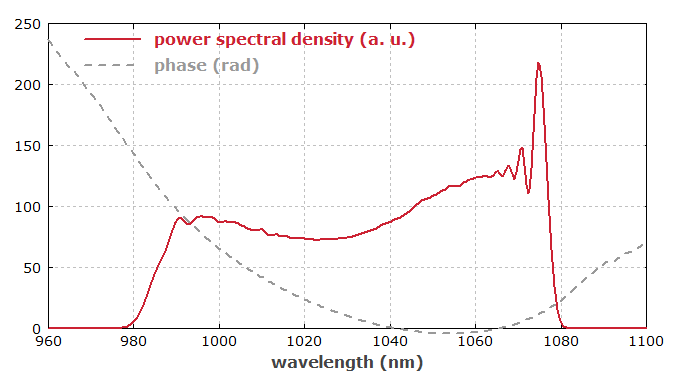
Figure 3 shows the spectrogram of the pulse after the fiber. Here, one can also see the up-chirp.
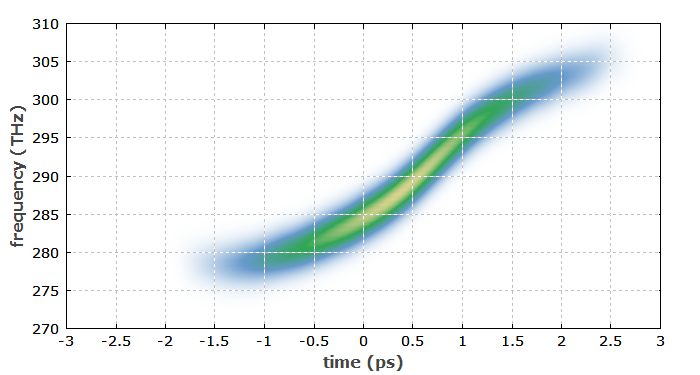
Figure 4 shows how the optical bandwidth, the energy and the duration of the pulses evolve in the fiber. The pulse bandwidth is measured on a level of 1% of the peak power spectral density (not as a full width at half maximum).
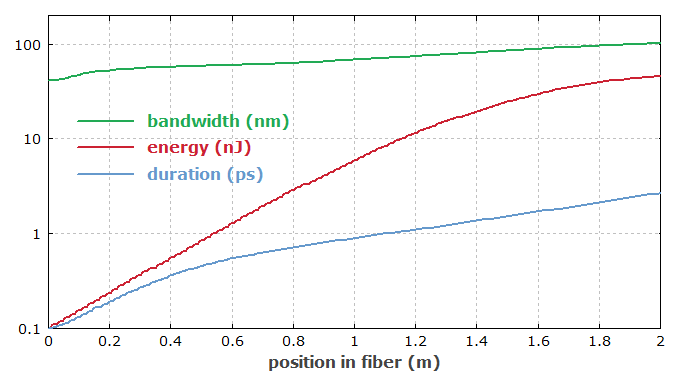
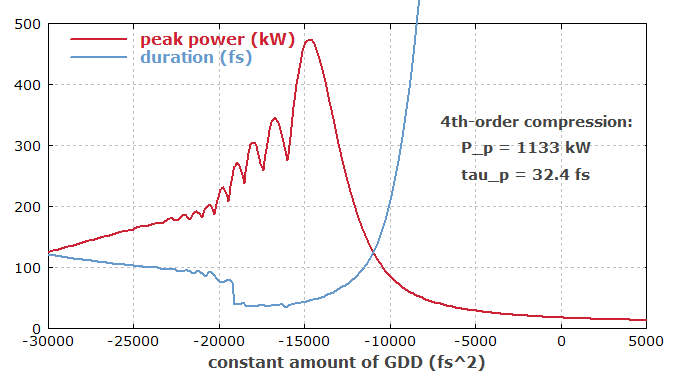
Figure 5 shows how the amplified pulse could be temporally compressed in a dispersive pulse compressor. The peak power and pulse duration are shown as functions of the applied second-order dispersion. The best compression is achieved for a dispersion of about −15000 fs2. Also, it is displayed in text form what compression results could be obtained with a compressor using optimized chromatic dispersion up to 4th order.
