RP Fiber Power – Simulation and Design Software
for Fiber Optics, Amplifiers and Fiber Lasers
| Overview | Features | Speed | Model |
| Data | Interface | Demos | Versions |
Example Case: Mode-locked Fiber Laser
Description of the Model
Here, we numerically simulate the pulse formation in an all-normal-dispersion mode-locked fiber laser (also called a dissipative soliton laser). Comparing with a typical mode-locked bulk laser or a soliton fiber laser, the details of pulse formation in such a laser are rather sophisticated, because there is a complicated interplay of nonlinear effects, spectral filtering and a saturable absorber. The pulse evolution in such fiber lasers has been discussed in W. H. Renninger et al., “Pulse shaping and evolution in normal-dispersion mode-locked fiber lasers”, IEEE J. Sel. Top. Quantum Electron. 18 (1), 389 (2012).
In each resonator round trip, the circulating pulse is transmitted through the following optical components:
- an output coupler with wavelength-independent transmission (for simplicity)
- a spectral bandpass filter
- a passive fiber
- an ytterbium-doped fiber
- another passive fiber
- a fast saturable absorber
This means that we need to define three different fibers in this model.
An interesting detail is the treatment of gain saturation. Normally, it would take millions of resonator round trip for the system to settle at its steady state. However, as the actual gain dynamics (with slow relaxation oscillations) are not of interest here, a solution is implemented which lets us find the steady state much faster – within only 100 round trips. In each round trip, the gain in the active fiber is calculated for the steady state which would be reached (after many round trips) for the given average signal power. The great flexibility of RP Fiber Power makes it easy to implement such tricks.
Results
Figure 1 shows the time-dependent optical powers during the first 100 resonator round trips. It also displays the instantaneous frequency, showing a pronounced up-chirp of the generated pulses.
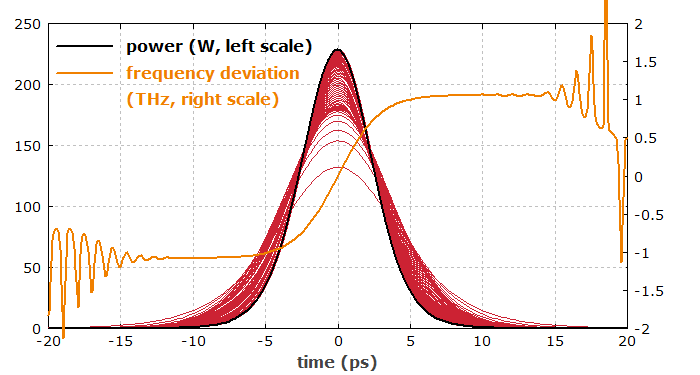
Figure 2 shows the same pulses in the frequency domain. One sees that the optical spectrum obtains a roughly rectangular shape, whereas the spectral shape is approximately parabolic, at least in the range with substantial power spectral density.
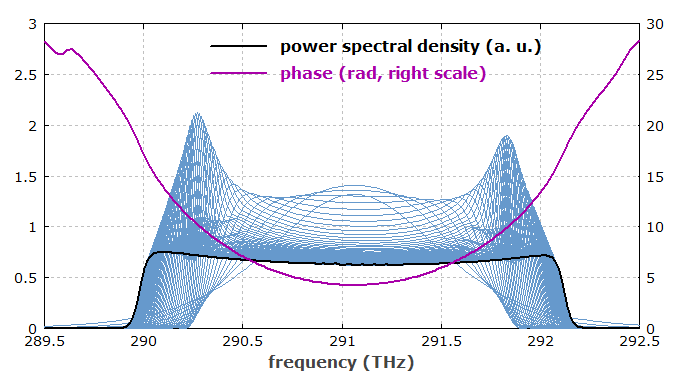
Figure 3 shows how the generated output pulse can be dispersively compressed. The amount of second-order dispersion required for optimum compression is calculated automatically. The small side pulses arise from the approximately rectangular spectral shape, not from imperfect dispersion compensation.
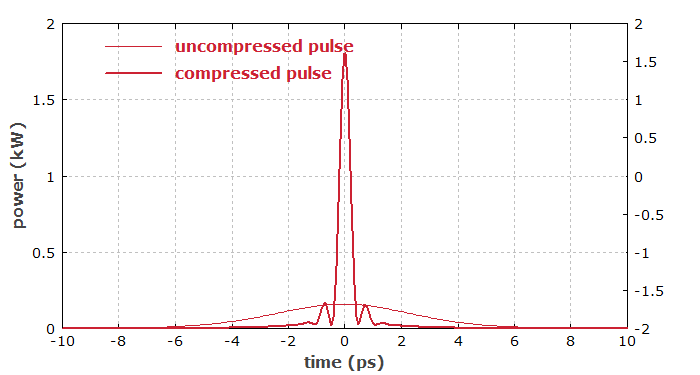
Figure 4 shows how the intracavity pulse parameter evolve during the 100 round trips. One sees that after 100 round trips the system is close to the steady state.
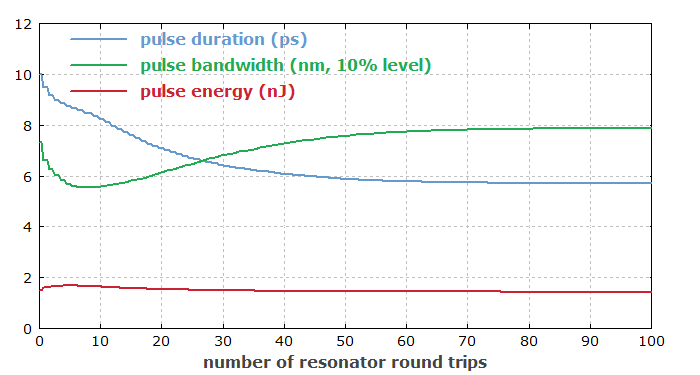
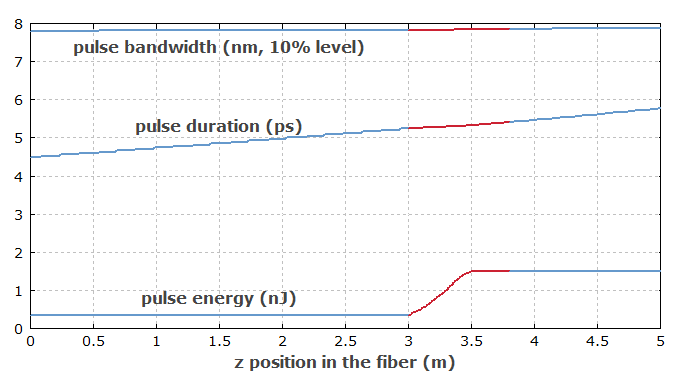
Figure 5 shows how the pulse parameters vary within the three fibers. The curves are shown in blue within the passive fibers and in red within the active fiber.
