RP Coating – Advanced Software for
Designing Optical Multilayer Structures
| Overview | Purpose | Model | Interface | Demos | Versions |
Demo File: Air-spaced Etalon
Here, we analyze an air-spaced etalon, consisting of two simple mirrors with some air space in between. That design can be described as a single structure, which includes one “layer” of air:
d_units: nm
l_units: nm

l_Bragg := 1000  { Bragg wavelength }
N_Bragg := 2  { number of layer pairs }
d := 0.1 mm / d_units  { distance between the mirrors (in d_units) }

beam from superstrate
substrate: BK7
for j := 1 to N_Bragg do
begin
* SiO2, l / 4 at l_Bragg
* TiO2, l / 4 at l_Bragg
end
* air, d = d, d_max = d
for j := 1 to N_Bragg do
begin
* TiO2, l / 4 at l_Bragg
* SiO2, l / 4 at l_Bragg
end
superstrate: BK7
The first diagram shows the transmissivity profile:
diagram 1:

"Transmissivity Profile"

x: 990, 1010
"wavelength (nm)", @x
y: 0, 100
"transmissivity (%)", @y
frame
hx
hy

f: 100 * T(x), color = red, width = 3, step = 1
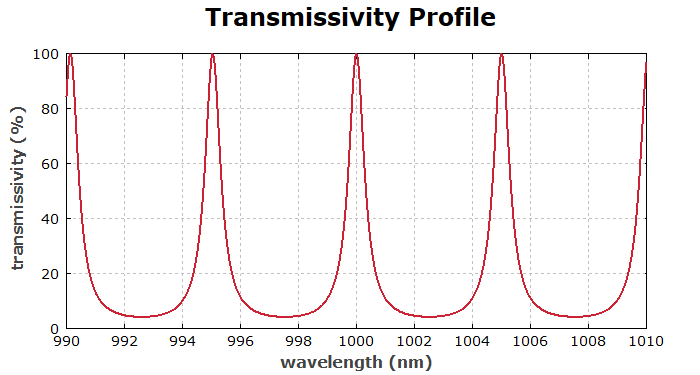
We see the transmission peaks corresponding to resonances of the structure.
A second diagram shows the transmissivity for a variable angle of incidence:
diagram 2:

"Transmissivity for Different Angles of Incidence"

"(for p polarization)"

x: 990, 1010
"wavelength (nm)", @x
y: -5, +5
"angle of incidence (°)", @y
frame
hx
hy

cp: color_I(T_p(x, y * deg))
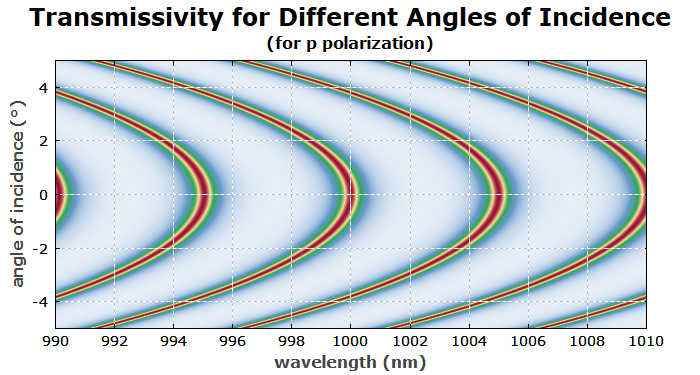
We see that the resonances move to shorter wavelengths when the etalon is tilted. Also, we see that a Gaussian beam with 100 μ beam radius, for example, having a beam divergence of only 3.2 mrad = 0.18°, will experience a nearly constant transmissivity over its angular range, as long as the angle of incidence is not too large.
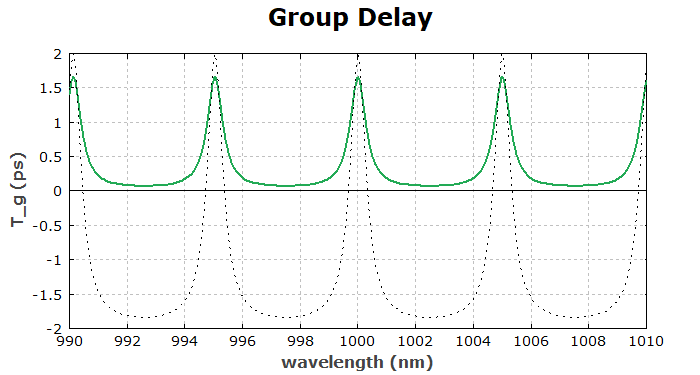
The third diagram plots the group delay in transmission as a function of wavelength, which is highest on the resonances (which are shown with the dotted curve):
diagram 3:

"Group Delay"

x: 990, 1010
"wavelength (nm)", @x
y: -2, +2
"T_g (ps)", @y
frame
hx
hy
legpos 420, 150
clip

f: T_g_t(x) / ps,
 color = green, width = 3

f: CS_y1 + T(x) * (CS_y2 - CS_y1), style = dotted

f: 0
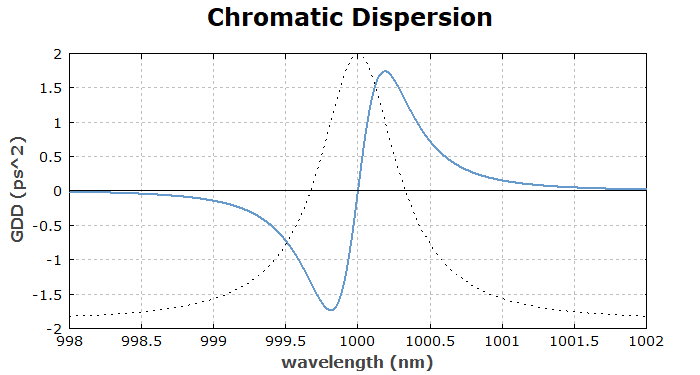
Next we look at the group delay dispersion, which is essentially the frequency derivative of the group delay:
diagram 4:

"Chromatic Dispersion"

x: 998, 1002
"wavelength (nm)", @x
y: -2, +2
"GDD (ps^2)", @y
frame
hx
hy
legpos 420, 150
clip

f: GDD_t(x) / ps^2, color = blue, width = 3, step = 1, maxconnect = 1

f: CS_y1 + R(x) * (CS_y2 - CS_y1), style = dotted

f: 0
We can also show how the field intensity is in and around the lower mirror:
diagram 6:

"Field Penetration"

x: 990, 1010
"wavelength (nm)", @x
y: -500, +2000
"depth in the mirror structure (nm)", @y
frame

! begin  { show the color scale on the right side of the diagram }
    var x1, x2;
    x1 := CS_x2 + 0.02 * (CS_x2 - CS_x1);
    x2 := CS_x2 + 0.04 * (CS_x2 - CS_x1);
    for y := CS_y1 to CS_y2 step (CS_y2 - CS_y1) / 500 do
    begin
      setcolor(color_I((y - CS_y1) / (CS_y2 - CS_y1)));
      line(x1 + i * y, x2 + i * y);
    end;
    setcolor(black);
  end

! (set_dir(1); R(lambda_t))

cp: color_I((R(x); E2(y) / 4))  { color plot }

; Show the layer boundaries:
f: 0
f: get_z(j), style = solid, color = lightgray, for j := 2 to nolayers()
f: get_z(2 * N_Bragg + 1)

"substrate", 200c, (-200)c
"mirror", 200c, (0.5 * get_z(2 * N_Bragg + 1))c
"air", 200c, (get_z(2 * N_Bragg + 1) + 200)c
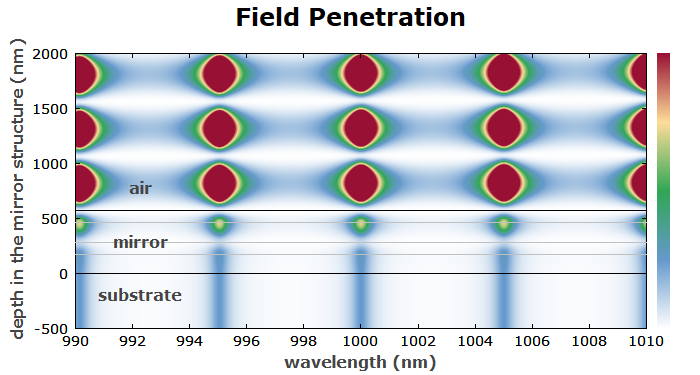
Finally, we explore what happens to an ultrashort pulse which is transmitted through the etalon. Although RP Coating does not have explicit ultrashort pulse features, its powerful script language makes it easy to simulate such things.
We first define the incident pulse with a duration of 2 ps:
A0 := 1  { peak amplitude }
tau0 := 2000 fs  { duration }
l0 := 1000 nm  { center wavelength }
f0 := c / l0  { center frequency }
A0%(t) := A0 / cosh(1.76 * t / tau0)  { envelope function }
E0(t) := Re(A0%(t) * expi(2pi * f0 * t))  { electric field }
Then we define one complex array for the complex amplitudes in the time domain, and another one for the frequency domain:
T := 20 ps  { width of the time range }
N := 2^10  { number of points }
dt := T / N  { temporal resolution }
t1 := -T / 2 + dt  { beginning of time trace }
t2 := T / 2  { end of time trace }
df := 1 / T  { frequency resolution }
f2 := (N / 2) * df  { end of frequency trace }
f1 := -f2 + df  { beginning of frequency trace }
defarray A%[0, T - dt, dt] (periodic)
defarray A_f%[f1, f2, df] (periodic)
Now we do the actual calculation: store the initial amplitudes in the time domain, do a fast Fourier transform (FFT) to get to the frequency domain, apply the effect of transmission through the etalon there, and transform back to the time domain:
calc
  begin
  for t := t1 to t2 step dt do A%[t] := A0%(t);
  FFT_n(A%[], A_f%[], +1);
  for f := f1 to f2 step df do A_f%[f] := t%(c / (f0 + f) / l_units) * A_f%[f];
  FFT_n(A_f%[], A%[], -1);
  end
Finally, we can define functions for the field at the output and use these for plots:
A%(t) := A%[t]
E(t) := Re(A%(t) * expi(2pi * f0 * t))

f: E0(x * fs), color = lightgray, step = 1
f: E(x * fs), color = blue, step = 1

f: abs(A0%(x * fs)), color = lightgray, step = 1
f: -abs(A0%(x * fs)), color = lightgray, step = 1
f: abs(A%(x * fs)), color = blue, step = 1
f: -abs(A%(x * fs)), color = blue, step = 1
We obtain the following:
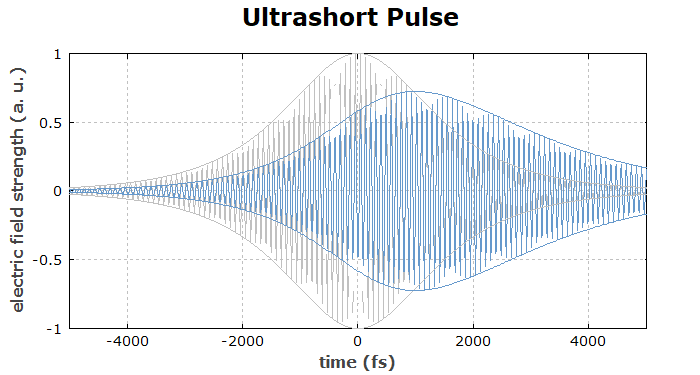
The transmitted pulse (in blue) is delayed against the incident pulse (gray). This is because it takes several round trips in the resonant structure until the internal field is fully built up.
We now do the same again for a pulse with a duration of only 200 fs. This leads to several transmitted pulses, separated by one round-trip time in the structure:
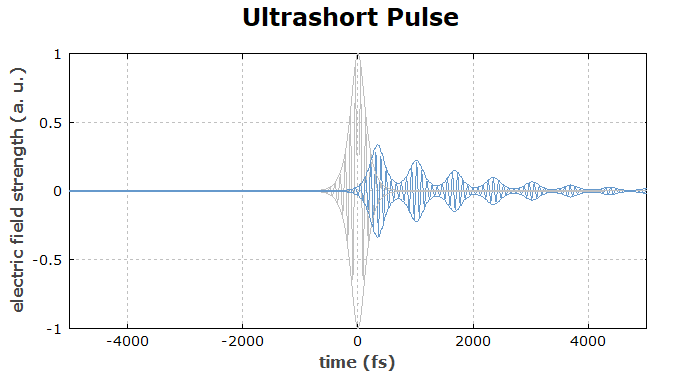
(Note that the fast electric field oscillations cannot be resolved with the limited resolution of the graphics windows.)
As the bandwidth of the pulse is of the order of the free spectral range, we cannot expect that we simply get a single pulse out, which is delayed by the group delay at the center wavelength.
