Modeling of Fiber Amplifiers and Lasers
This is part 7 of a tutorial on modeling of fiber amplifiers and lasers from Dr. Paschotta. The tutorial has the following parts:
1: Introduction, 2: Optical channels, 3: Power propagation or field propagation, 4: The laser-active ions, 5: Continuous-wave operation of amplifiers and lasers, 6: Amplifying and generating short pulses, 7: Ultrashort pulses, 8: Using home-made software or a commercial product?
Part 7: Ultrashort Pulses
For pulse durations in the picosecond or even femtosecond regime, additional physical effects come into play. One of these is chromatic dispersion, i.e., the wavelength dependence of the effective refractive index of the fiber. (Note that we normally need to take into account waveguide dispersion, except for some large mode area fibers.) Also, fiber nonlinearities can have strong effects. One may have to consider not only the Kerr nonlinearity, but also the delayed nonlinear response which results in stimulated Raman scattering. These aspects are discussed in part 8 of our fiber amplifier tutorial.
The combination of numerical beam propagation with ultrashort pulses would be quite demanding in terms of computation time and memory. Fortunately, in most cases one will deal with situations where the transverse spatial effects are not of interest; we can assume fixed transverse intensity profiles (see section 3).
How to Represent Ultrashort Pulses
For each z position in the fiber, we now need to consider the time-dependent complex field amplitude. Some details:
- One usually uses field envelope amplitudes A(t). The electric field strength is proportional to Re(A(t) exp(−i ω0 t)) where ω0 is the mean angular frequency. The complex field amplitudes may be normalized such that their squared modulus corresponds to the optical powers.
- The amplitudes need to be stored within a temporal range which is sufficiently large to span e.g. somewhat more than the considered optical pulse. Numerically, one needs an array of amplitudes with a temporal spacing which is fine enough to properly sample the pulses at all times. Normally, the number of components of that field should be a power of 2 in order to facilitate the use of Fourier techniques (see below).
- One usually uses a “moving time frame”, where an injected pulse remains centered around t = 0 as long as nonlinear and dispersive effects do not shift the pulse maximum.
The appropriate choice of parameters for the temporal grid (width of time range, temporal resolution, number of points) is not always obvious. During the simulations, one may have to monitor whether the chosen grid parameters are sufficient for a reasonable numerical accuracy. For calculations on mode-locked lasers, 256 grid points are sometimes already sufficient, whereas simulations involving strongly chirp pulses or even supercontinuum generation require far more.
Propagation Equations
The required propagation equations can become substantially more complicated than for longer pulses. As an example, the following equation for the complex amplitude A(z,t) describes the propagation of a single optical channel under the effects of amplifier gain, background losses, chromatic dispersion of second and third order, and nonlinear effects including a delayed nonlinear response (Kerr effect and stimulated Raman scattering). The nonlinear response function R(τ) is related to the Fourier-transformed Raman gain spectrum.

When multiple optical channels propagate together, there are additional nonlinear coupling terms, making things even more complicated.
Solving the Equations with Fourier Methods
Effects like chromatic dispersion and wavelength-dependent gain and losses are usually treated in the frequency domain. This means that one has to apply a Fourier transform algorithm (usually a Fast Fourier Transform = FFT) to the above-mentioned temporal trace in order to obtain an array of complex amplitudes in the frequency domain. There, one can easily apply frequency-dependent phase changes and/or amplitude changes. (For example, the second time derivative corresponding to second-order dispersion corresponds to a simple multiplication factor −ω2 in the frequency domain.) With a reverse Fourier transform, one gets back to the time domain.
One usually uses a kind of split-step Fourier algorithm. Efficient computations often require an automatic step size control, because a much smaller numerical step size may be required at locations in the fiber where a pulse acquires a high peak power due to amplification and/or dispersive compression. Correctly handling the terms for a delayed nonlinear response (Raman scattering) is particularly difficult; additional Fourier transforms are needed for an efficient solution.
Software Helps
Even though the technical details for ultrashort pulse propagation are rather complicated, a powerful simulation software makes it relatively simple for the user to calculate and simulate such things. The software must be provided with suitable fiber data concerning dispersion and nonlinearities, and also the user must usually determine the numerical parameters for representing the pulses – for example, the width of the temporal traces, the number of sampling points and the center wavelength. These together determine the frequency (or wavelength) range which can be numerically represented.
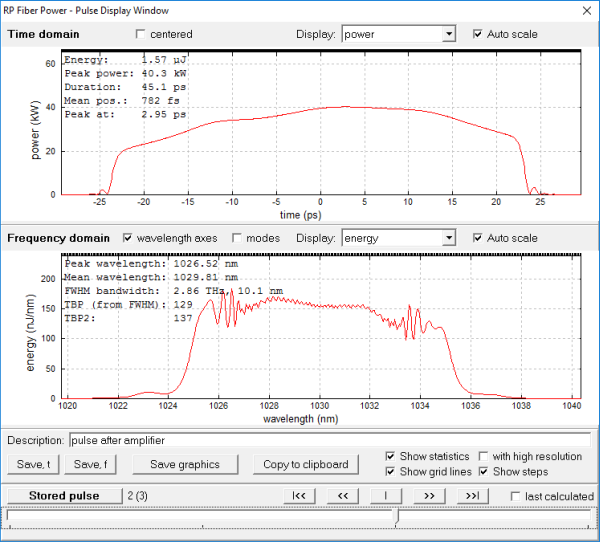
A good software tool cannot only do such calculations reliably and quickly, but also conveniently display the calculated results. As an example, Figure 5 shows the interactive pulse display window of the RP Fiber Power software, which makes it easy to inspect pulses at any point within the fiber. However, interactive window should not be the only way to access the data; one should also have scripting capabilities for efficient control and data processing.
Requirements for Some Example Cases
Different simulation scenarios can be relevant for practical work:
- Simple cases require only single-pass propagation, e.g. of signal pulses through a fiber amplifier. One may then want to inspect the resulting pulses not only at the output end, but at any location within the fiber.
- One may also have to deal with a sequence of different fibers and possibly other optical elements influencing the pulses. For example, input pulses may be sent through a pulse stretcher, then through the active fiber and finally through a pulse compressor in order to exploit the principle of chirped-pulse amplification. It is then highly desirable that the software is sufficiently flexible e.g. to allow the generation of diagrams where any parameters of the resulting pulses are plotted as functions of any parameters of the system.
- When studying mode-locked fiber lasers, one may need not only to investigate a single round-trip in the laser resonator (which can comprise multiple optical elements including active and passive fibers, modulators, optical filters, saturable absorbers, etc.), but rather the evolution in multiple round-trips. One may even want to automatically propagate the pulse until it reaches the steady state (if that exists), and do this for a certain range of parameters. (Of course, the software should be able to automatically determine when the steady state has been approximately reached.) One may, for example, plot the achieved pulse duration (possibly after an automatically adjusted pulse compressor) as a function of the amount of chromatic dispersion in the laser resonator.
A simple simulation software may offer single-pass simulations with all relevant details, but may not be usable for more sophisticated studies e.g. on mode-locked lasers. For example, if one would always have to manually transfer a pulse from one fiber to the next one, or manually perform subsequent round-trips until pulse parameters do not change significantly any more, the procedure could simply become far too tedious. Powerful scripting support for automating such procedures, as offered by RP Fiber Power, can be indispensable.
We have published a case study for a mode-locked fiber laser which serves as a nice example. It is an all-normal-dispersion laser, which exhibits relatively complicated pulse formation dynamics. Figure 2 is taken from that case study; it shows how the optical spectrum of the circulating pulse converges to the steady state, leading to a nearly rectangular spectral shape.
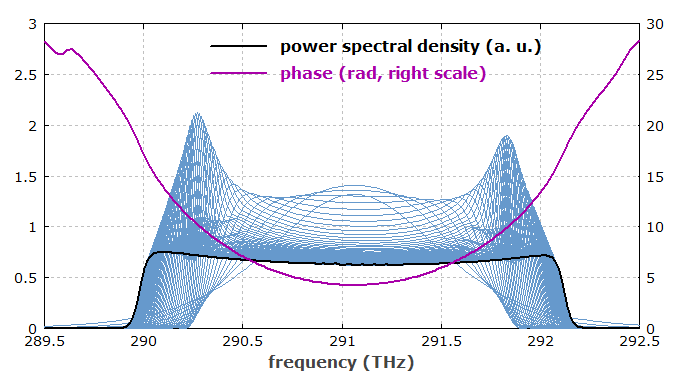
Figure 3 shows how the pulse parameters approach the steady state. These parameters are always taken for the pulse as it occurs directly before it hits the output coupler. One could now change various parameters of the laser resonator in order to check how these affect the convergence to the steady state.
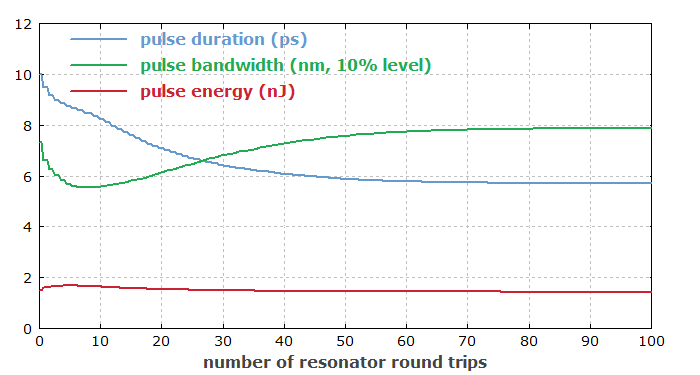
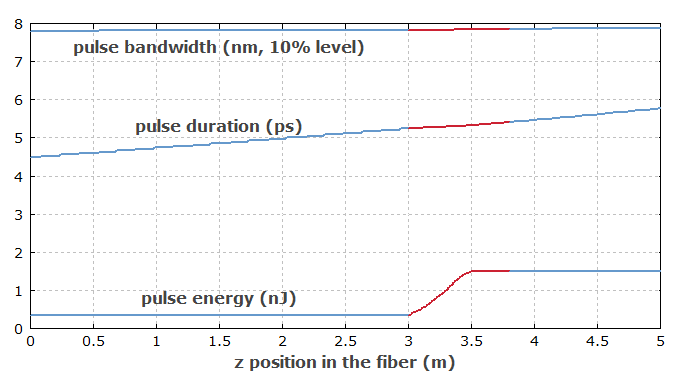
Figure 4 shows how the pulse parameters vary within the resonator (in the steady state). One sees that when going from left to right, the pulse duration rises substantially, while the pulse bandwidth rises only slightly. Both parameters are reset by a bandpass filter in the resonator.
Flexibility is Crucial
From such examples one can see that the high flexibility of a well made simulation tool is not just nice, but rather is essential for real work. It is not sufficient to be able to simulate a round trip in the laser resonator; one also needs to generate various kinds of plots in order to gain a clear understanding of what is happening in such lasers. Also, one needs a flexible interactive tool for inspecting pulses anywhere in the resonator, particularly if one has not yet found suitable parameters for stable pulse formation. Once the crucial factors for pulse stability have been identified, one could also make a color plot, for example, which indicates the pulse stability as a function of two different parameters.
Note that the powerful script language, as our software offers it, gives you the maximum degree of flexibility. Even if the designer of a software without that feature would have predefined a huge number of different diagrams, you may well find that what you need in practice is outside that selection. Therefore, you want to be able to control any details of diagrams, sequences of fibers and other optical elements, optimization strategies, etc.
Go to Part 8: Using home-made software or a commercial product?, or back to the start page.
Questions and Comments from Users
Here you can submit questions and comments. As far as they get accepted by the author, they will appear above this paragraph together with the author’s answer. The author will decide on acceptance based on certain criteria. Essentially, the issue must be of sufficiently broad interest.
Please do not enter personal data here; we would otherwise delete it soon. (See also our privacy declaration.) If you wish to receive personal feedback or consultancy from the author, please contact him e.g. via e-mail.
By submitting the information, you give your consent to the potential publication of your inputs on our website according to our rules. (If you later retract your consent, we will delete those inputs.) As your inputs are first reviewed by the author, they may be published with some delay.


These sharing buttons are implemented in a privacy-friendly way!


