RP Fiber Power – Simulation and Design Software
for Fiber Optics, Amplifiers and Fiber Lasers
| Overview | Features | Speed | Model |
| Data | Interface | Demos | Versions |
Example Case: Calculating Fiber Modes
Description of the Model
This script demonstrates the calculation of fiber modes with the integrated mode solver. It uses a given refractive index profile of the fiber core, which is defined with tabulated values. (Of course, one could also work with a formula defining the index profile.) With a few lines of script code, these are read into an array, and the index function nf(r) uses interpolated values from that array:
r_co := 10 um  { core radius }
n_cl := 1.44  { cladding index }
dr := 2 um  { radial resolution of index table }
defarray n_f[0, r_co, dr]
readlist r, n_f[r * um]:
 0, 1.442
 2, 1.444
 4, 1.444
 6, 1.443
 8, 1.441
 10, 1.44
n_f(r) := if r <= r_co then n_f~~[r] else n_cl
That function now simply needs to be associated with the fiber:
calc set_n_profile("n_f", r_co)
Thereafter, a lot of different functions are available, which allow one to access all mode properties, such as the intensity profiles, propagation constants, etc.
Results
The following figures display properties of the calculated fiber modes. In addition, it would be easily possible to use the mode profiles when defining optical channels for power calculations.
Note that the mode solver is very efficient. Even when a fiber has several hundreds of modes (i.e., many more than in this example case), the whole set of modes is calculated within roughly a second on an ordinary PC.
Figure 1 shows all radial functions for the calculated modes. Different colors are used for different l values. The refractive index profile and the effective indices of the modes are also shown.
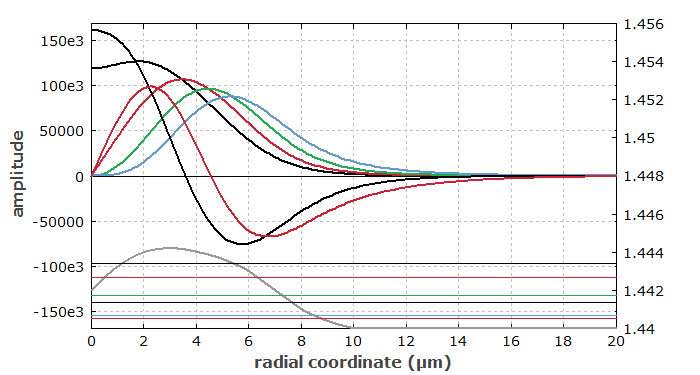
Figure 2 shows the intensity profiles of all modes with animated graphics.
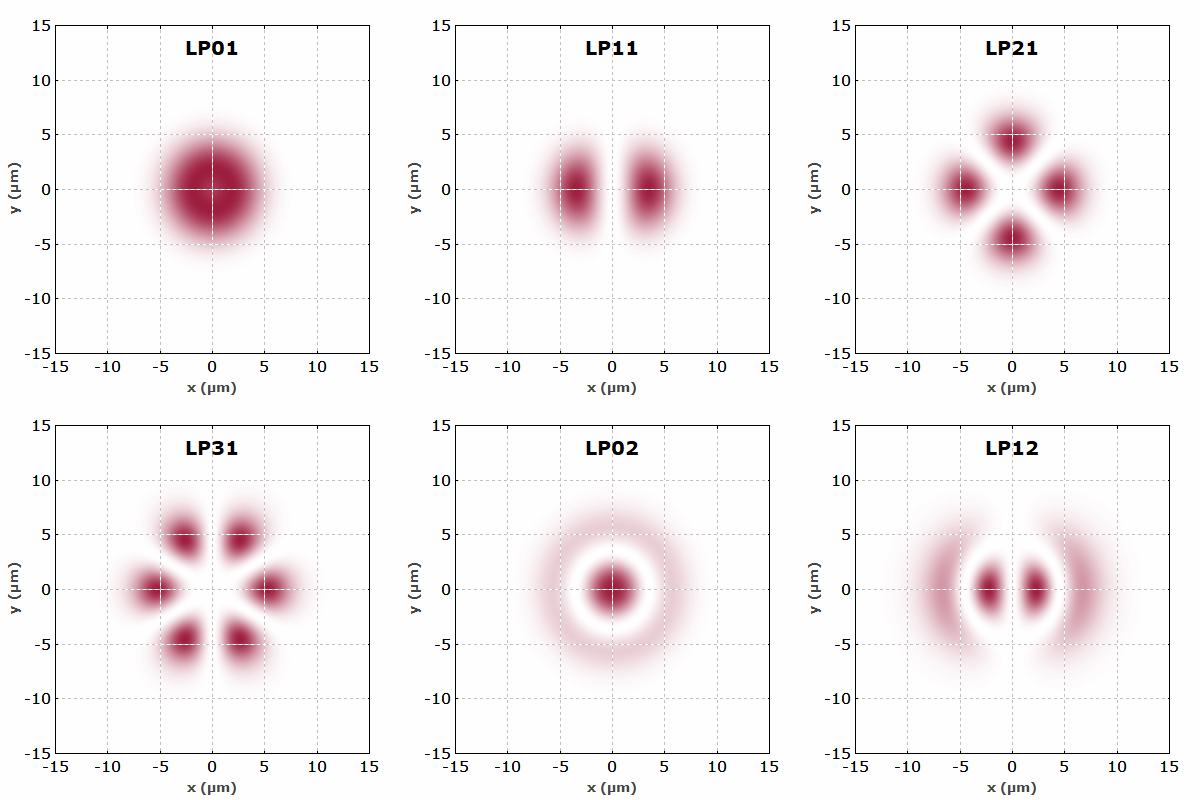
Figure 3 shows the effective refractive indices of all modes (calculated from the propagation constants) as functions of the wavelength. These values approach the cladding index (1.44) at their cut-offs.
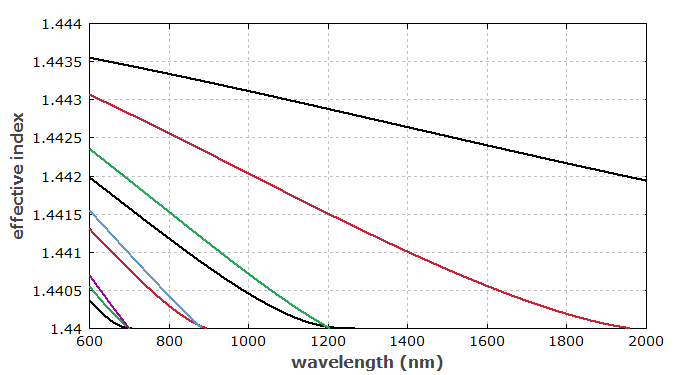
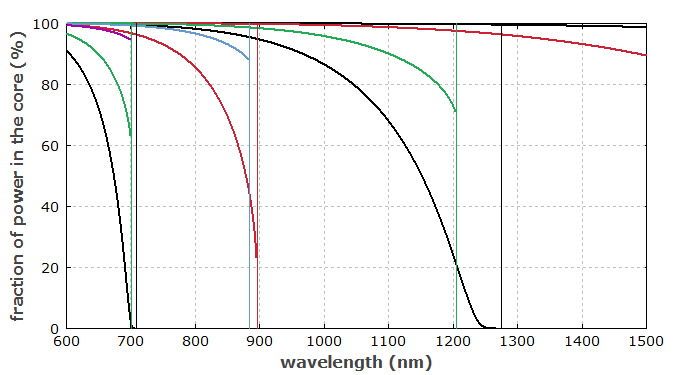
Figure 4 shows the fraction of the optical power which is contained in the fiber core, when the wavelength is varied. When approaching the cut-off, this values decreases.
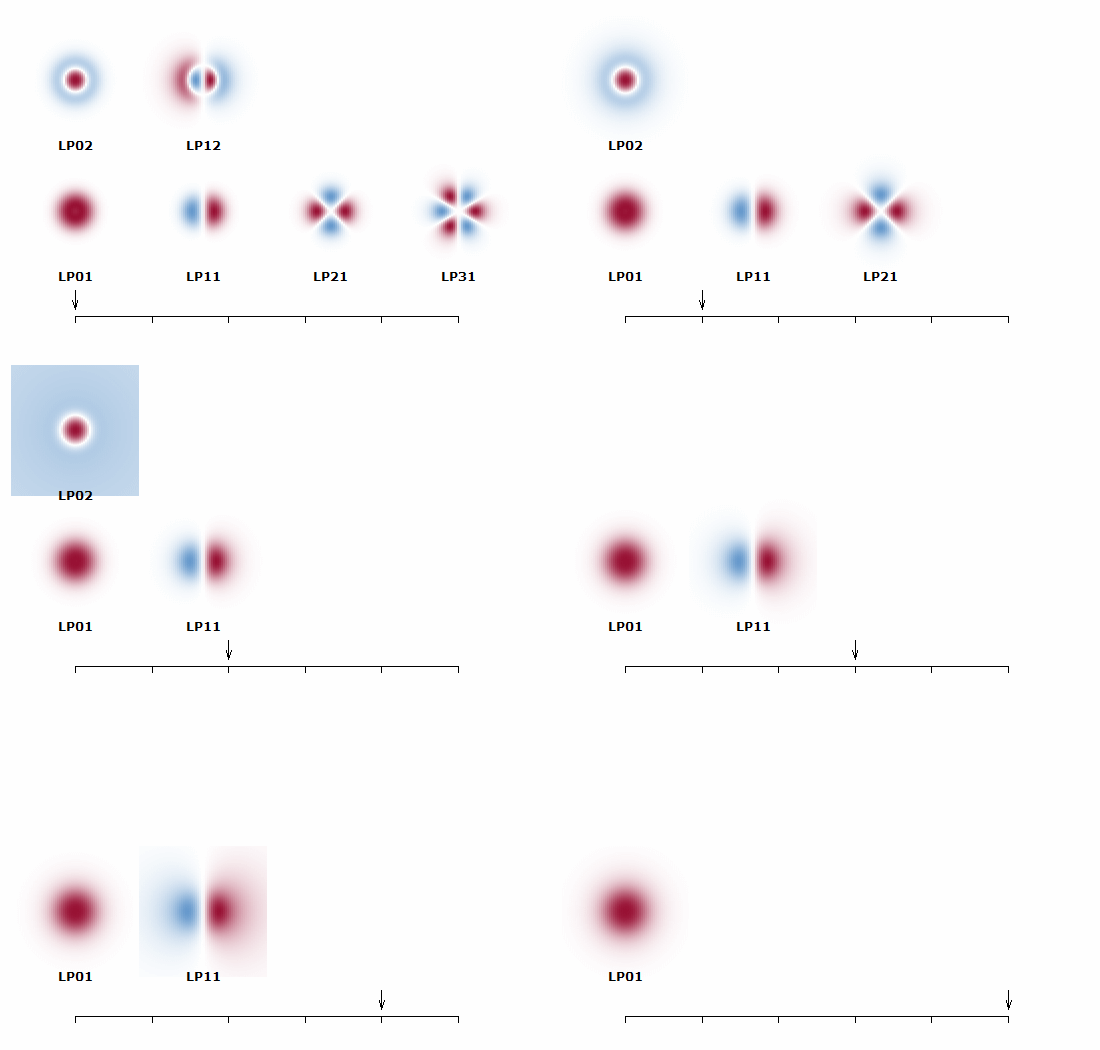
Finally, Figure 5 shows with animated graphics how more and more modes disappear when the wavelength is reduced. Also note that modes get larger near their cut-off.
