RP Fiber Power – Simulation and Design Software
for Fiber Optics, Amplifiers and Fiber Lasers
| Overview | Features | Speed | Model |
| Data | Interface | Demos | Versions |
Example Case: Erbium-doped Fiber Amplifier
Description of the Model
We simulate a fiber amplifier with the following properties:
- The fiber exhibits single-mode propagation at the signal and pump wavelength. Both signal and pump modes have an approximately Gaussian intensity distribution, with slightly different mode radii.
- The erbium doping density has a dip in the middle, as is typical for such fibers.
- The amplifier is bidirectionally pumped, with 400 mW of pump power at 980 nm from each side. The input signal has a power of 1 mW.
- As there is significant amplifier gain, amplified spontaneous emission (ASE) must be included.
- Some amount of upconversion losses is taken into account.
Results
Figure 1 shows the power distributions in the amplifier fiber, including ASE, and also the fractional erbium excitation level. The latter is higher on the left side, because the signal power is lower there.
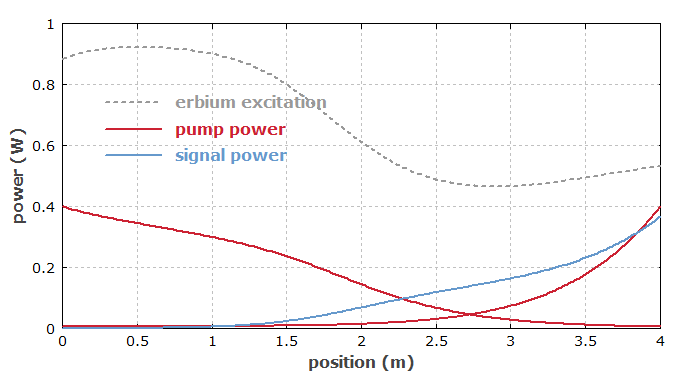
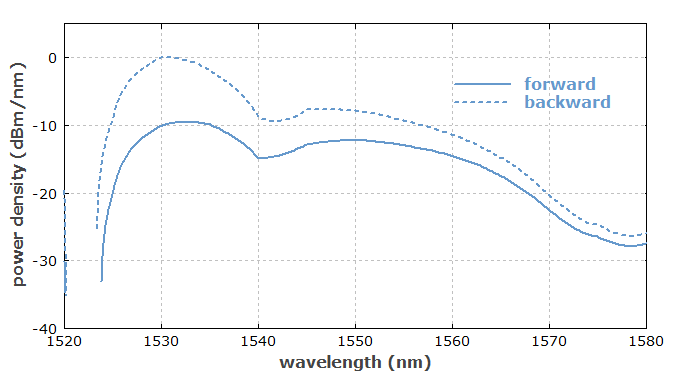
Figure 2 shows the optical spectrum of amplified spontaneous emission (ASE) for both directions. Backward ASE is significantly stronger at short wavelengths. This is the usual case for quasi-three-level gain media.
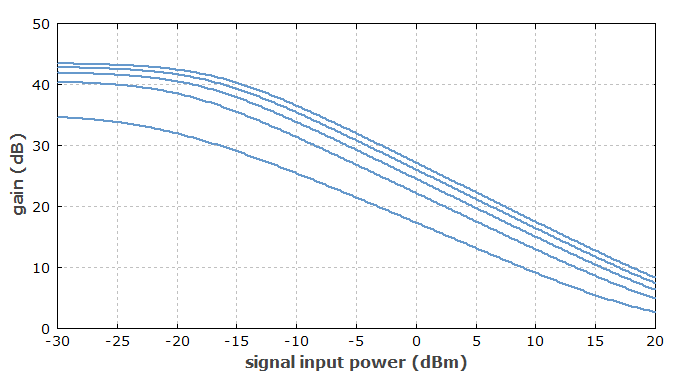
Next we consider the saturation characteristics: the amplifier gain is reduced for high input power levels. Curves are shown for pump powers of 100 mW to 500 mW (from each side).
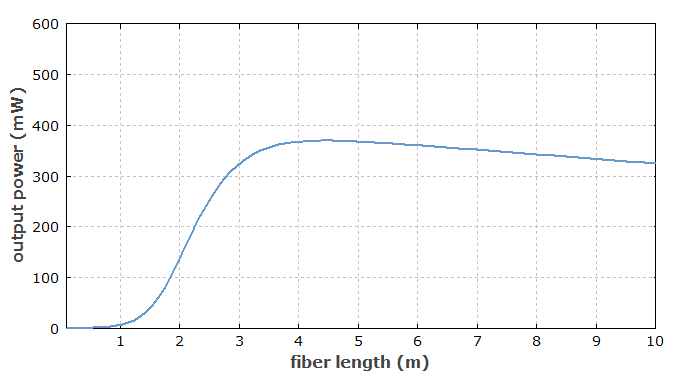
Now we check the dependence of amplifier output signal power on the fiber length. This shows that the fiber length is in that case not a very critical parameter for the power efficiency.
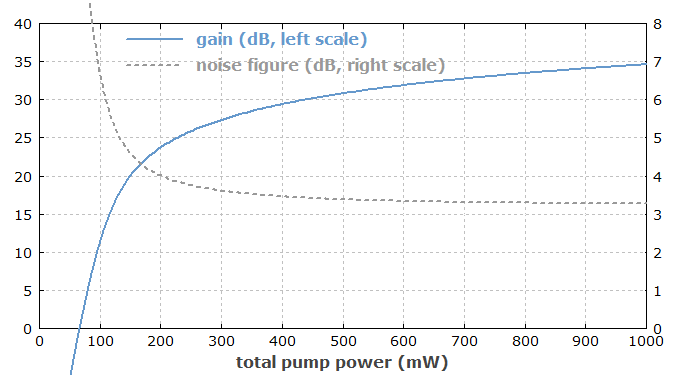
The last graph shows the gain and the noise figure at the signal wavelength as functions of the total pump power.
