
![]()
RP Fiber Power – Simulation and Design Software
for Fiber Optics, Amplifiers and Fiber Lasers
| Overview | Features | Speed | Model |
| Data | Interface | Demos | Versions |
Example Case: ASE Source with Automatic Spectral Optimization
Description of the Model
We simulate a source of amplified spontaneous emission with the following properties:
- The ytterbium-doped single-mode fiber is pumped at 975 nm.
- Initially, the fiber is assumed to be not reflecting on both ends. This leads to about equal ASE powers in forward and backward direction, with the spectral shape being determined by the emission and absorption cross sections (among other factors).
- We then automatically optimize the reflectivities on the left side of the fiber to obtain an ASE spectrum in forward direction which is as flat as possible in a given spectral range of 1010 nm to 1050 nm. This takes a few lines of script code.
Results
Figure 1 shows the ASE spectrum during and after automatic optimization (with several iterations) of the reflectivities at the left fiber end, and the required reflectivity curve.
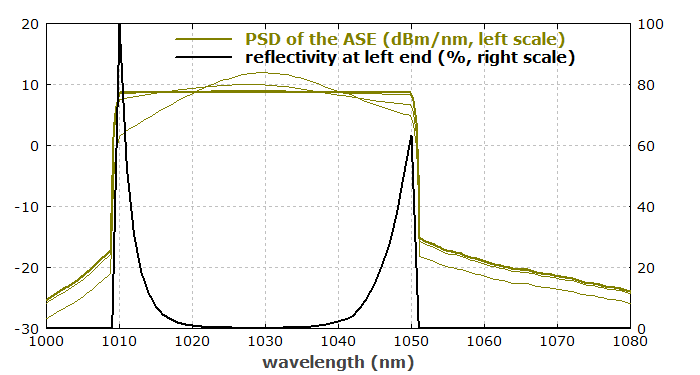
The result is a very flat ASE spectrum. It is achieved with a reflectivity which is highest at the outer parts of the chosen spectral range. In the middle part, where the gain is highest, the reflectivity must be low. Of course, it may be challenging to precisely realize such a reflectivity spectrum.
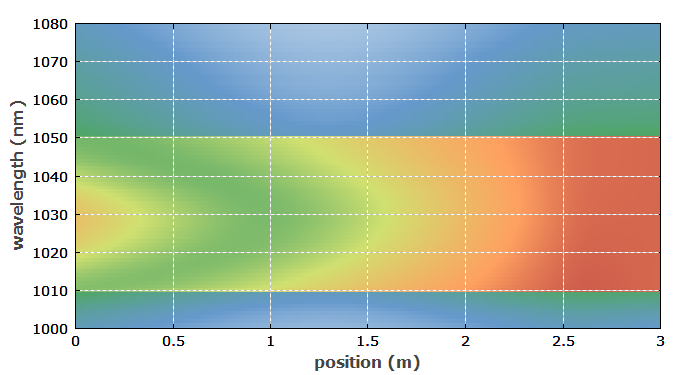
Figure 2 shows the internal spatial distribution of spectrally resolved ASE. It is apparent that the power spectral density of the ASE is flat on the right side within the given spectral region, whereas the spectral distribution at other locations is different.
The presented optimization technique has been successfully used in an experiment, see R. Paschotta et al., “Efficient superfluorescent light sources with broad bandwidth”, IEEE J. Sel. Topics on Quantum Electron. 3 (4), 1097 (1997).