How to Efficiently Track Down Numerical Problems
Posted on 2017-08-18 in the RP Photonics Software News (available as e-mail newsletter!)
Permanent link: https://www.rp-photonics.com/software_news_2017_08_18.html
Author: Dr. Rüdiger Paschotta, RP Photonics Consulting GmbH
Abstract: It can be rather hard to track down numerical problems e.g. in beam propagation and to find practical solutions. However, some good methodology can help a lot. An example case allows you to take home a number of quite useful lessons.

When working with a numerical model, it sometimes happens that one encounters problems with non-ideal numerical accuracy. In some cases, it can be very tedious to understand and solve such problems, when not applying good methods of problem analysis. I thought it might be helpful for many to describe an example case which I recently had in the technical support for our software RP Fiber Power. Although certain technical details are quite specific to that problem, you can learn essential interesting techniques of more general applicability from this report.
What was the Problem?
The customer (a scientific researcher) was investigating the propagation of so-called orbital angular momentum modes (OAM modes) in fibers, using the numerical beam propagation feature of our software. (Such modes exhibit helical wavefronts; if you circle around the center in some arbitrary distance from it, you see in over all phase change which is an integer multiple of 2 π.) Specifically, the customer wanted to find out how additional effects like amplification might cause mode coupling, i.e., the transfer of optical power into other modes. He then noticed that some amount of mode coupling happened even without any physical effects from which it could be expected – even for propagating in a passive fiber without any special properties. The difficulty was that the simulation was rather time-consuming, so that it was not practical to do many experiments e.g. with different settings of numerical parameters or other changes to the simulation scripts. He had already found that using a final transverse resolution of the numerical grid deed reduce the numerical errors significantly, but not dramatically, while a finer longitudinal resolution did not help at all. So it was unclear what to do.
Steps Towards the Solution
At that stage, I took over. Because it can happen that one overlooks some vital detail in a longer script, I first radically simplified the script, deleting all sorts of details which seemed not to be relevant for the problem. Indeed, the numerical problem remained after that, but I could be sure that the problem had to be a quite fundamental one, rather than the result of some overlooked detail of the script. That was definitely worth spending 10 or 15 minutes.
I was definitely not keen at all to do lots of time-consuming test runs. Therefore, the next step was to modify the simulation such that the computation time is much shorter. In the present case, the essential and very simple measure was to radically cut down the length of fiber considered. In addition, I somewhat reduced the transverse resolution. As a result, one simulation run now took only a few seconds instead of many minutes. That gave me the opportunity to much more quickly test the effect of changes e.g. to numerical details or included physical effects. And it was no problem that the investigated numerical errors were now on a much lower level; they could still be easily observed.
Further, I required better tools for assessing the magnitude and kind of the problem. That was also relatively straightforward. With a few lines of script code, I defined a function which calculates the optical power in a particular orbital angular momentum mode at a certain longitudinal position, and a diagram where the evolution of the relevant mode powers was nicely shown.
Also, I wanted to find out whether the problem is mainly related to errors of the field amplitudes or the phases. Therefore, I defined modified functions for the mode powers, where I combined the amplitudes of the beam propagation results with the optical phases of calculated modes (from the mode solver) and vice versa; this quickly showed that the problem was mainly with the optical phases.
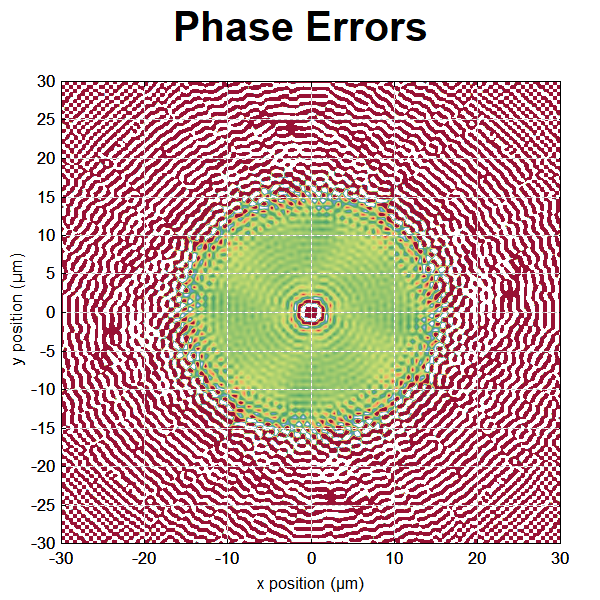
Further, I defined a diagram with a color plot showing the spatial distribution of phase errors at the fiber end:

The correct phase values result in green color, while red and white indicate deviations to different sides. By the way, phase errors in the outer regions are not relevant, since the mode amplitudes anyway get extremely small when reaching a distance of 15 μm from the center.
Not much script code was required for that nice and instructive diagram:
diagram 2, size_px = (600, 600):

"Phase Errors"

x: -r_max / um, +r_max / um
"x position (µm)", @x
y: -r_max / um, +r_max / um
"y position (µm)", @y
frame
hx
hy

phase_error(x, y, z) :=
  arg(bp_A%(x, y, z) / bp_A%(10 um, 0, z) * A_lm_xy_oam%(-l, m, lambda_s, x, y))

cp: color_I(0.5 + 10 * phase_error(x * um, y * um, L_f))
I could now quite quickly check how the situation changes with modified numerical parameters, but again found that only a higher transverse spatial resolution helps, and that did not even help much. For some time, it looked like a hard problem without a nice solution. Just working with far higher numerical resolution would not have been a practical solution for the client.
Now came the difficult part, requiring careful observations and the use of physical intuition:
- I made a similar test with LP modes instead of orbital angular momentum modes. There, the numerical errors were far smaller; there was nearly no artificial coupling in that case. This observation confirmed a previous suspicion that the problem is related to the lack of radial symmetry of the numerical grid. The idea is basically that radial symmetry is important for those orbital angular momentum modes (but not for LP modes), while the numerical grid (considering just one plane) is of course rectangular.
- I also looked again at the diagram with the phase errors (see above). I noticed how much the problem was apparently starting at the core–cladding boundary. Now came the essential idea: the fiber was assumed to be a step-index fiber, i.e., to have a sharp transition from core index to cladding index. When you describe such a circular structure with sharp edges on our rectangular grid, of course you don't get a perfect circle, but rather the more or less pronounced structures around the circle. So it is actually not far-fetched to imagine that those structures could cause the artificial mode coupling between OAM modes of opposite circulation.
- Once that was realized, it was easy to make further progress: just try a refractive index profile with a somewhat smoother core–cladding interface, which looks much more circular on a rectangular grid. I just used a supergaussian function with high order (e.g. 40, 60 or even 80), which is quite similar to a rectangular profile, but has a somewhat smoothed transition. And indeed the numerical errors now became far smaller than before, even though I did not use a particularly fine grid resolution! Problem solved!
The conclusion in this particular problem case was that for numerical beam propagation one should not use a step-index profile, but rather one which is at least a little smoothed: it is sufficient if the transition from core to cladding can be sampled with only a few points of the numerical grid. Such an index profile is even more realistic, since diffusion during the fiber drawing process will anyway not allow for an ideally sharp transition.
Lessons to Take Home
Here is a short summary of the general lessons you can take home. When you tackle such numerical problems, consider the following points:
- First remove all details which are presumably irrelevant to the problem. That avoids the risk of spending a lot of time on various aspects while overlooking some nasty factor.
- Try to reproduce the numerical problem in a situation which requires much less computation time. That way, you can try many more things within an hour.
- Don't hesitate to invest a little time into creating useful tools for problem analysis – for example, displaying crucial numbers or some instructive diagrams. That way, you can much more easily make use of following test runs.
- Try to make use of your physical intuition, rather than considering the problem as a purely mathematical one. That may suggest additional tests which can rule out certain explanations and confirm others, so that you get closer and closer to the core of the problem. This is probably the most difficult part, but I often found it to be absolutely essential to make progress.
Well, there is actually another important lesson. When looking for simulation software, make sure that you get one where you get excellent technical support – not restricted to purely software-specific details, but helping you also with more general advice, e.g. concerning the related physics. I am afraid that you can rarely be sure to get that when searching for simulation software, but I am doing my best to make sure that our customers are getting it!
This article is a posting of the RP Photonics Software News, authored by Dr. Rüdiger Paschotta. You may link to this page, because its location is permanent.
Note that you can also receive the articles in the form of a newsletter or with an RSS feed.
 |

If you like this article, share it with your friends and colleagues, e.g. via social media:
These sharing buttons are implemented in a privacy-friendly way!